Meet Filipe: The Summer Challenge Winner
What inspired you to participate in the Summer Challenge?
I had some contact with data-driven decision-making back in college, and I really liked it back then. I remember considering starting my career in that field, but I eventually leaned towards web development – something that I was also really keen on. This uncertainty came to a point where I even got a couple of really interesting work proposals at the same time, one for web development and other for data analytics. I opted for web development, so the data topic has been on standby for a while. Around a year ago after around eight years of web development I was a bit bored and feeling the need for a change, and to work on different scopes (data being one of them), so I quit my job as Team Leader in a marketing agency and started working on my own as a freelancer. As most of my contacts have connections to my previous jobs, it’s not so easy to get out of the web scope. So, when I saw the Data Science Summer Challenge information, the data appeal kicked in, so I didn’t think twice and applied for it.
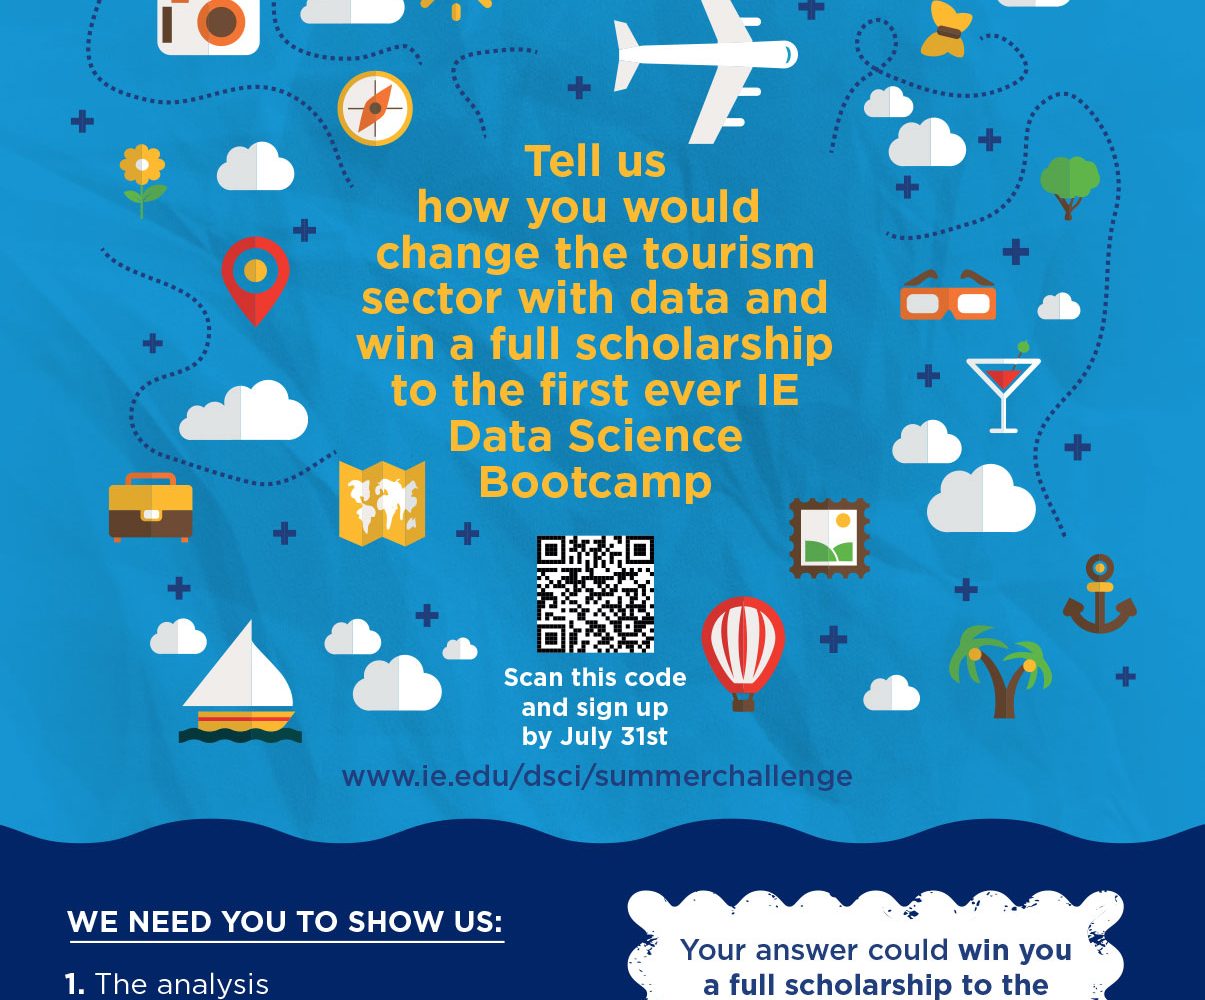
How did you propose improving the tourism industry with data?
It’s a really broad challenge. So, I started by narrowing it down to surf tourism. I surf, I love it, and I’ve been witnessing the booming of surf tourism in Portugal. Surf planning’s extremely difficult as it depends on a lot of variables that change quickly: tides, swell size and direction, wind strength and direction, bathymetry, and so on. So, there’s a lot of local knowledge involved. It’s way more complicated than snow tourism, for instance. Naturally, in any outdoor activity practitioners seek conditions suitable to their ability, but there’s no such thing as standard color code like the ones you have in ski resorts portraying the difficulty of the tracks. I’ve been watching the surf tourists coming to Portugal mostly during the summertime when the waves are really small and damaged by the North seasonal wind. So, my idea was basically to build a framework/system where we could automatically classify the surf spots according to quality, consistency, and degree of difficulty. We could use it for both short- and long-term predictions. There’s a ton of data out there we could use to build such as system like weather archives, weather forecasts both with available APIs and also online surf guides.With such a system, we could actually have easy-to-read color codes like the ones we see in the ski resorts, find the year to year patterns, help surfers to find traveling opportunities, and spread surf tourism more evenly and adequately through the season.
What was the hardest part of the presentation?
Actually, I didn’t struggle much to realize how to tackle the problem. I have some ideas I’d like to develop at some point, and this was one of them. So basically, I just had to search for my “bucket list” the best match for the challenge. The hardest part was definitely fitting the whole thing into a two-minute video! I lost count on how many trials I had to do. I think my first one was around 15 minutes.
After participating in the Data Science Bootcamp, would you change anything in your approach to the Summer Challenge question?
This is a good one. For sure I would, with all the new tools that I’ve been discovering during the Bootcamp. But I’d have to give it a good thought, though!
Related posts
1 July 2022