
Quality
Quality
- Home
- Quality
INTERNAL QUALITY ASSURANCE SYSTEM
INTERNAL QUALITY ASSURANCE SYSTEM
The Internal Quality Assurance System (IQAS) incorporates all the processes that IE University uses to monitor and improve the quality of its degree programs. Implementation of the IQAS facilitates the collection of relevant information regarding the university’s degree programs, which is then analyzed in order to carry out improvements to the quality of our education.
PUBLIC INFORMATION
PUBLIC INFORMATION
INFORMATION AND DATA BY DEGREE
INFORMATION AND DATA BY DEGREE
Sources: Integrated System of University Information _(Sistema Integrado de Información Universitaria)._ Ministry of Science, Innovation and Universities _(Ministerio de Ciencia, Innovación y Universidades)._
Doctorado en Ciencias Empresariales
SATISFACCIÓN DE LOS DOCTORES EGRESADOS (2020-2025)
- El 94% Considera que las actividades académicas son satisfactorias para sus necesidades.
- El 94% Está muy satisfecho con la dirección de tesis y el nivel de exigencia del título.
- El 91% Consideran apropiados los recursos y fondos bibliográficos.
- El 100% Valora positivamente el título de Doctorado.
- El 100% Recomienda el título de Doctorado.
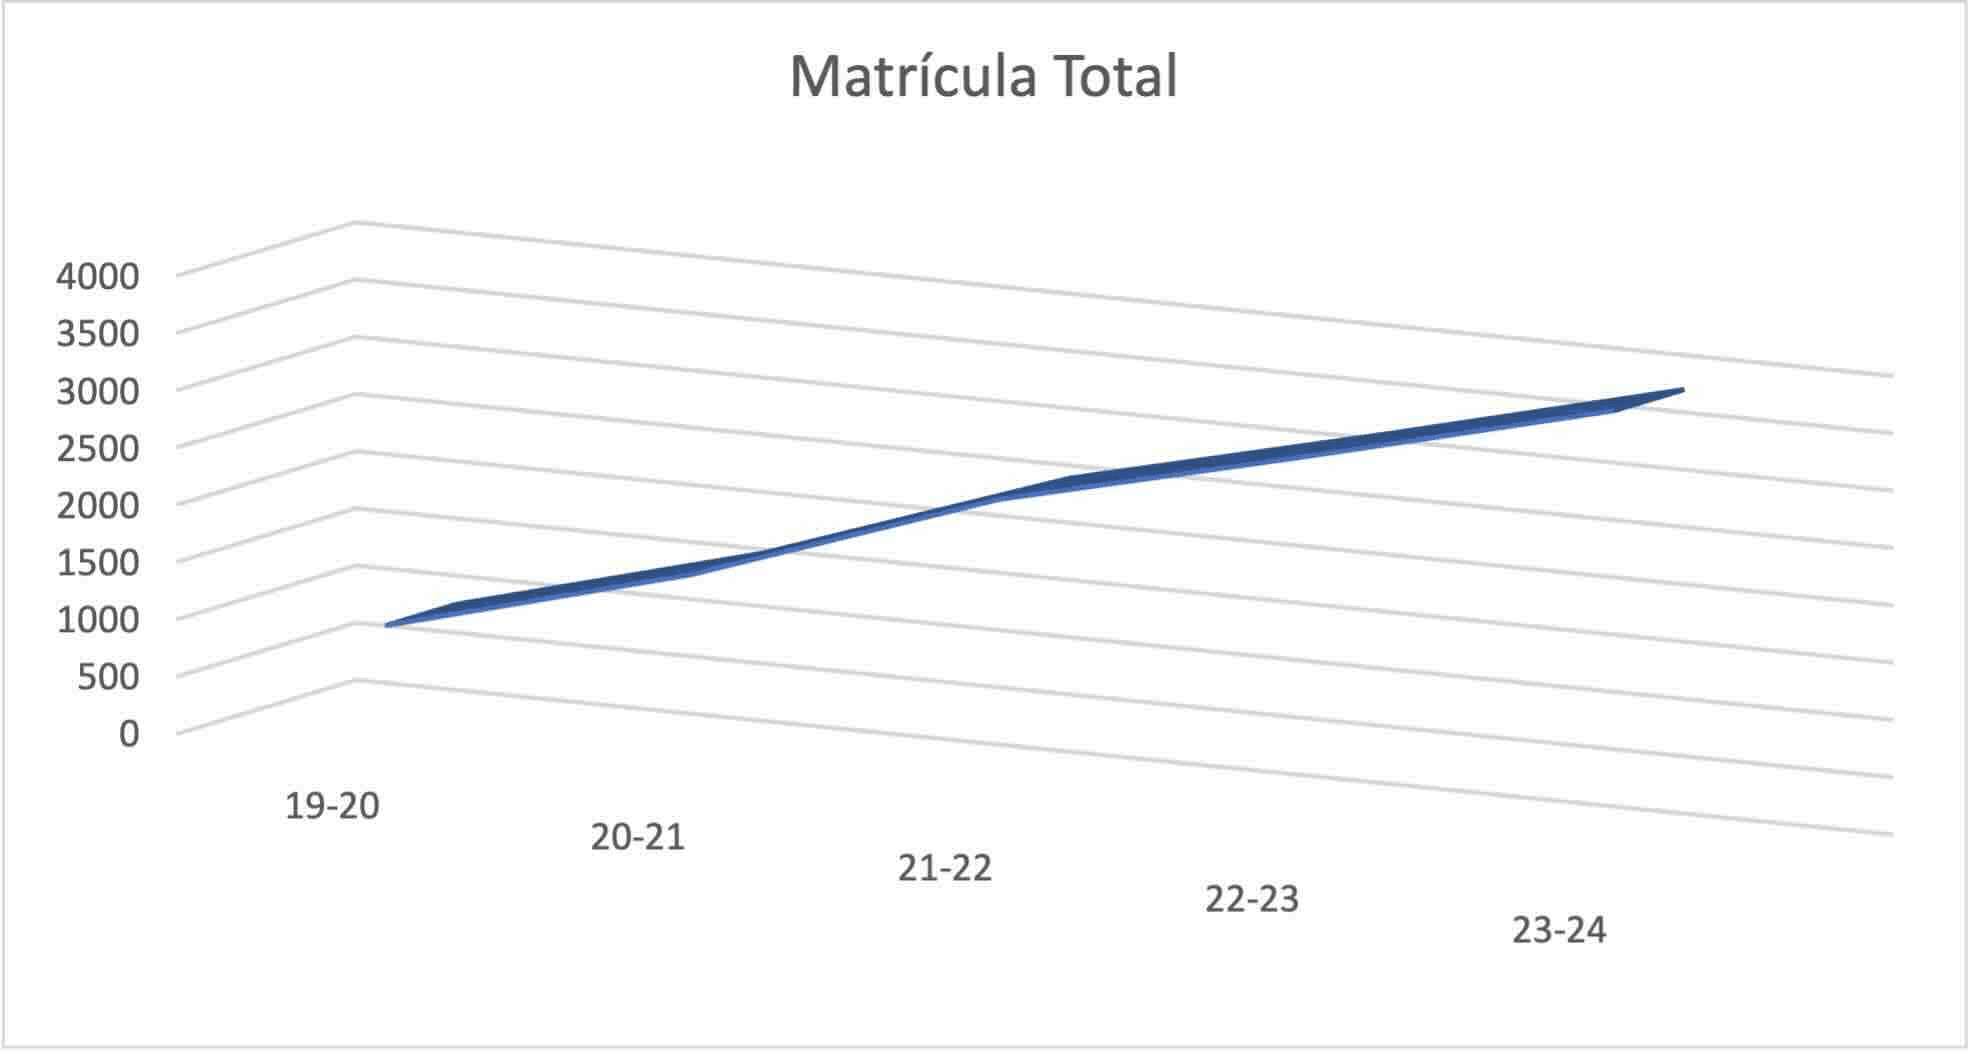
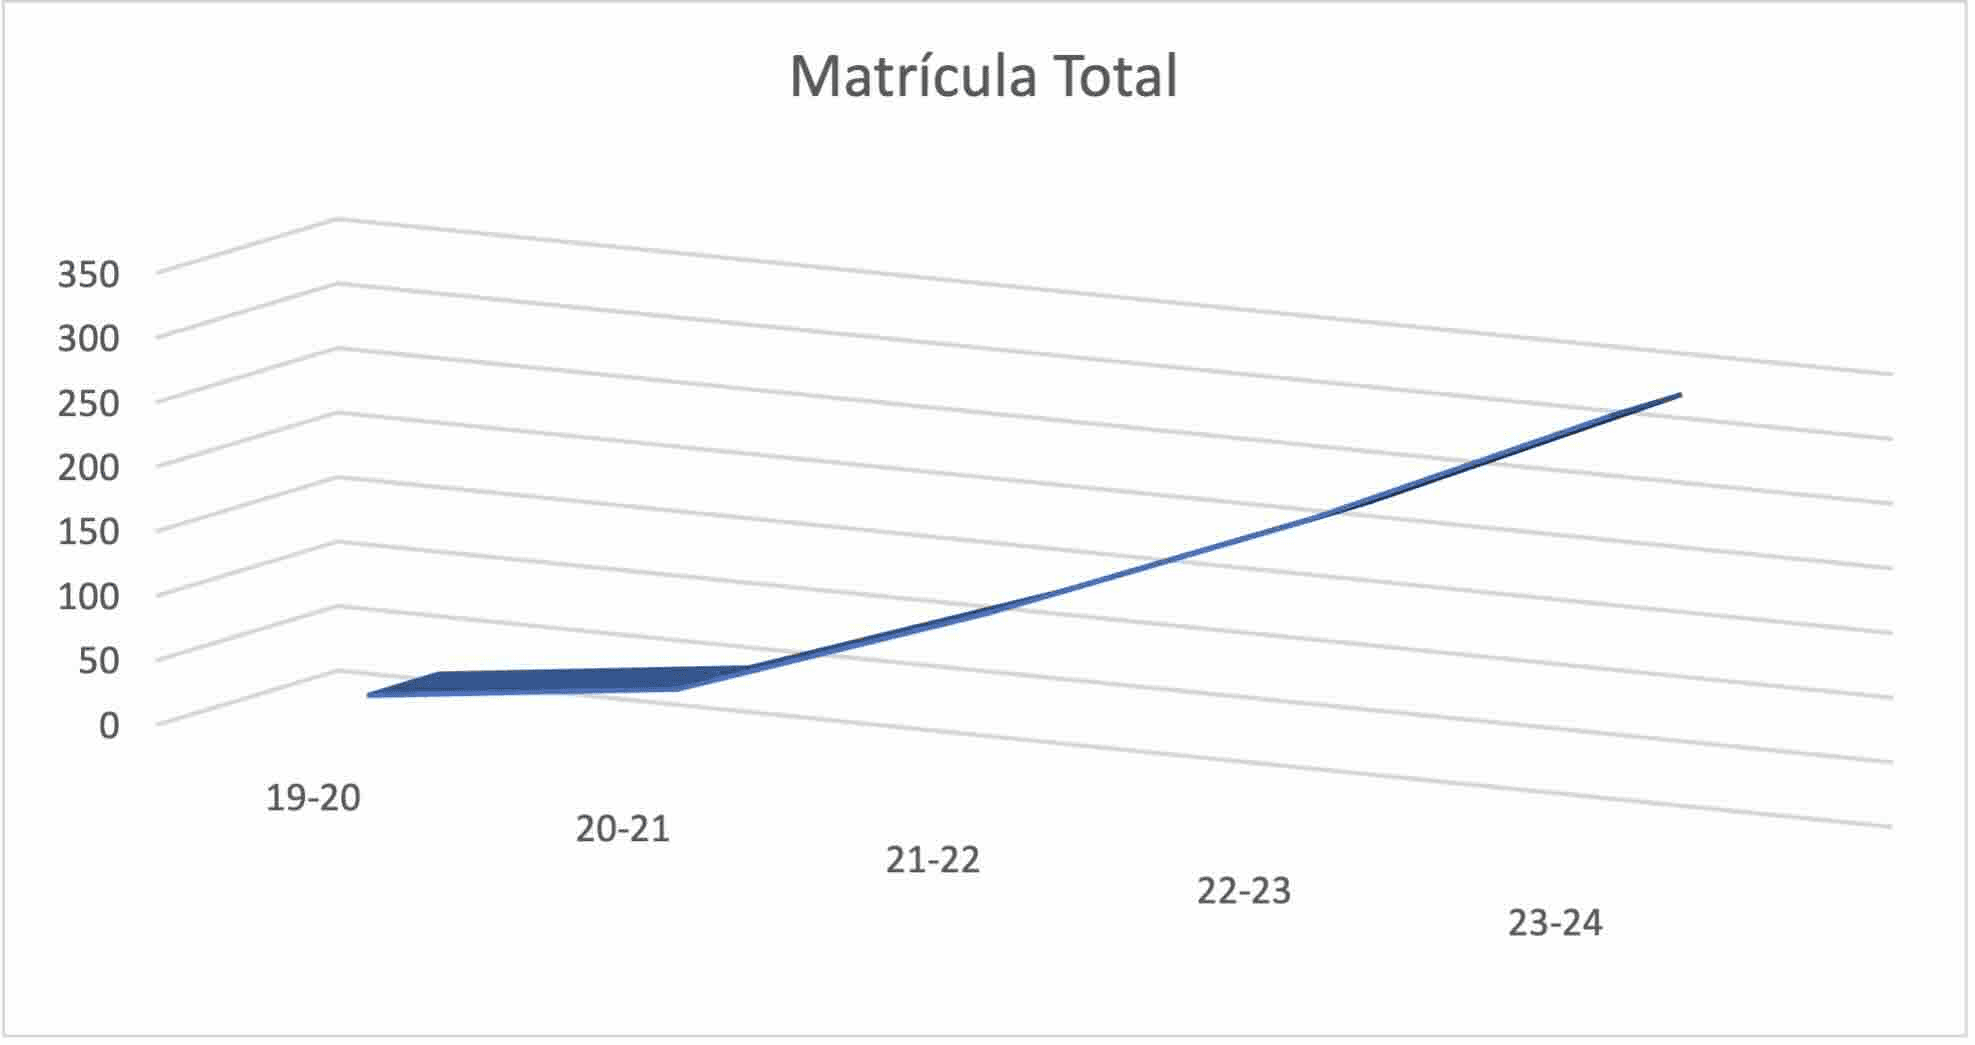
Grado en Administración de Empresas
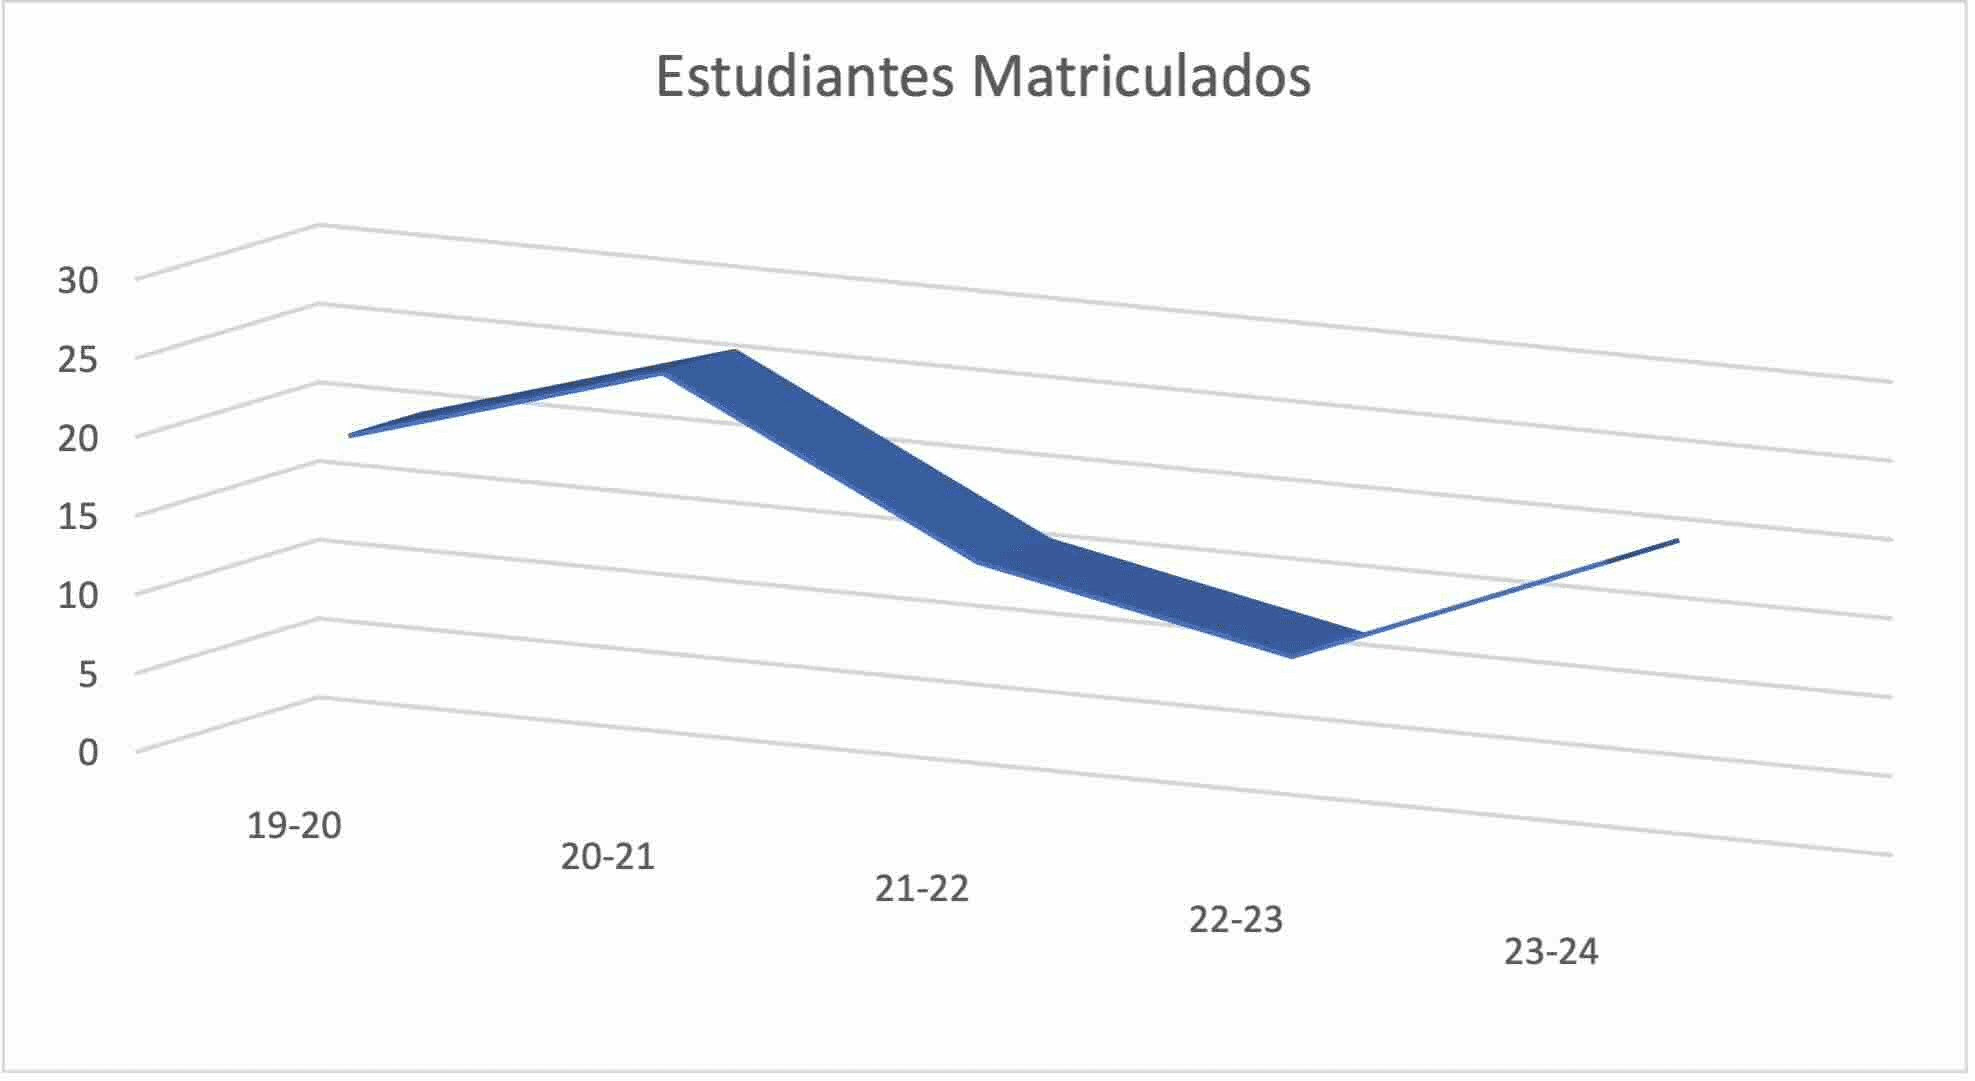
MATRÍCULA TOTAL
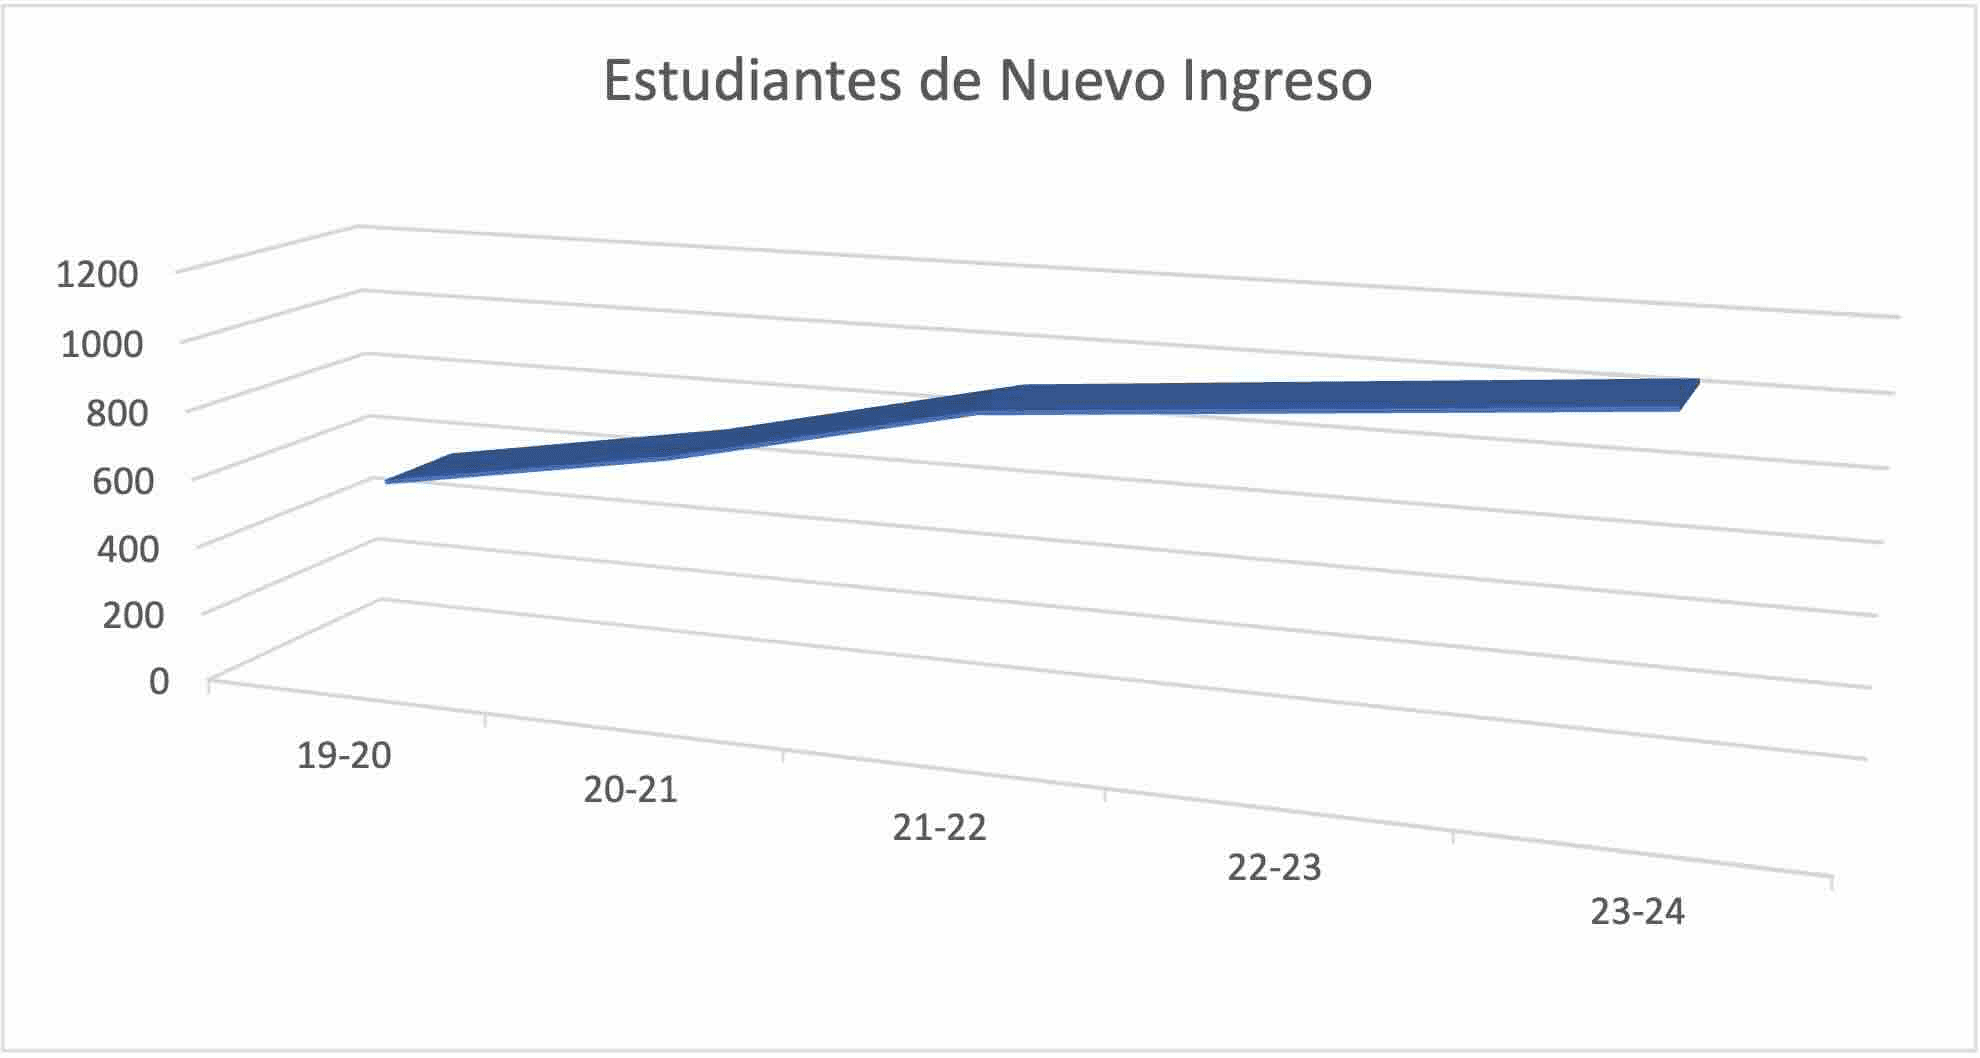
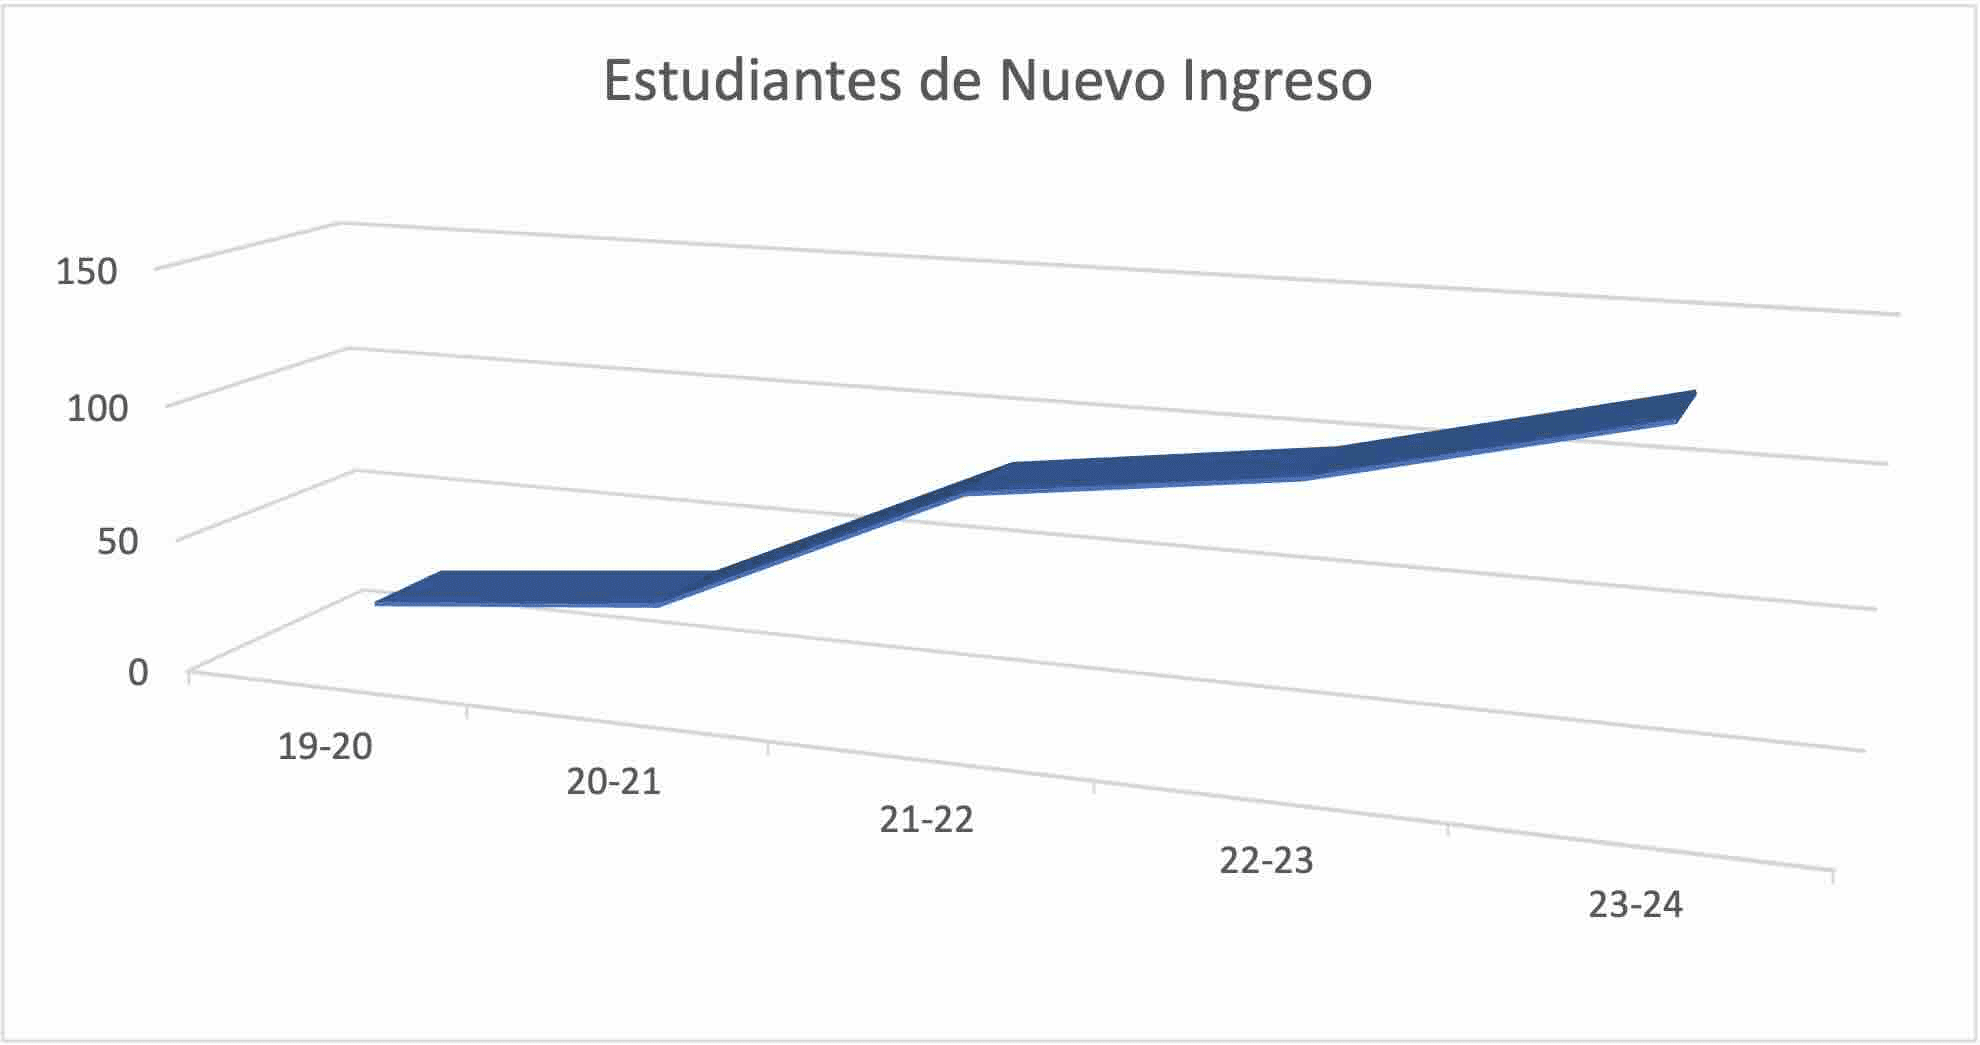
ESTUDIANTE DE NUEVO INGRESO
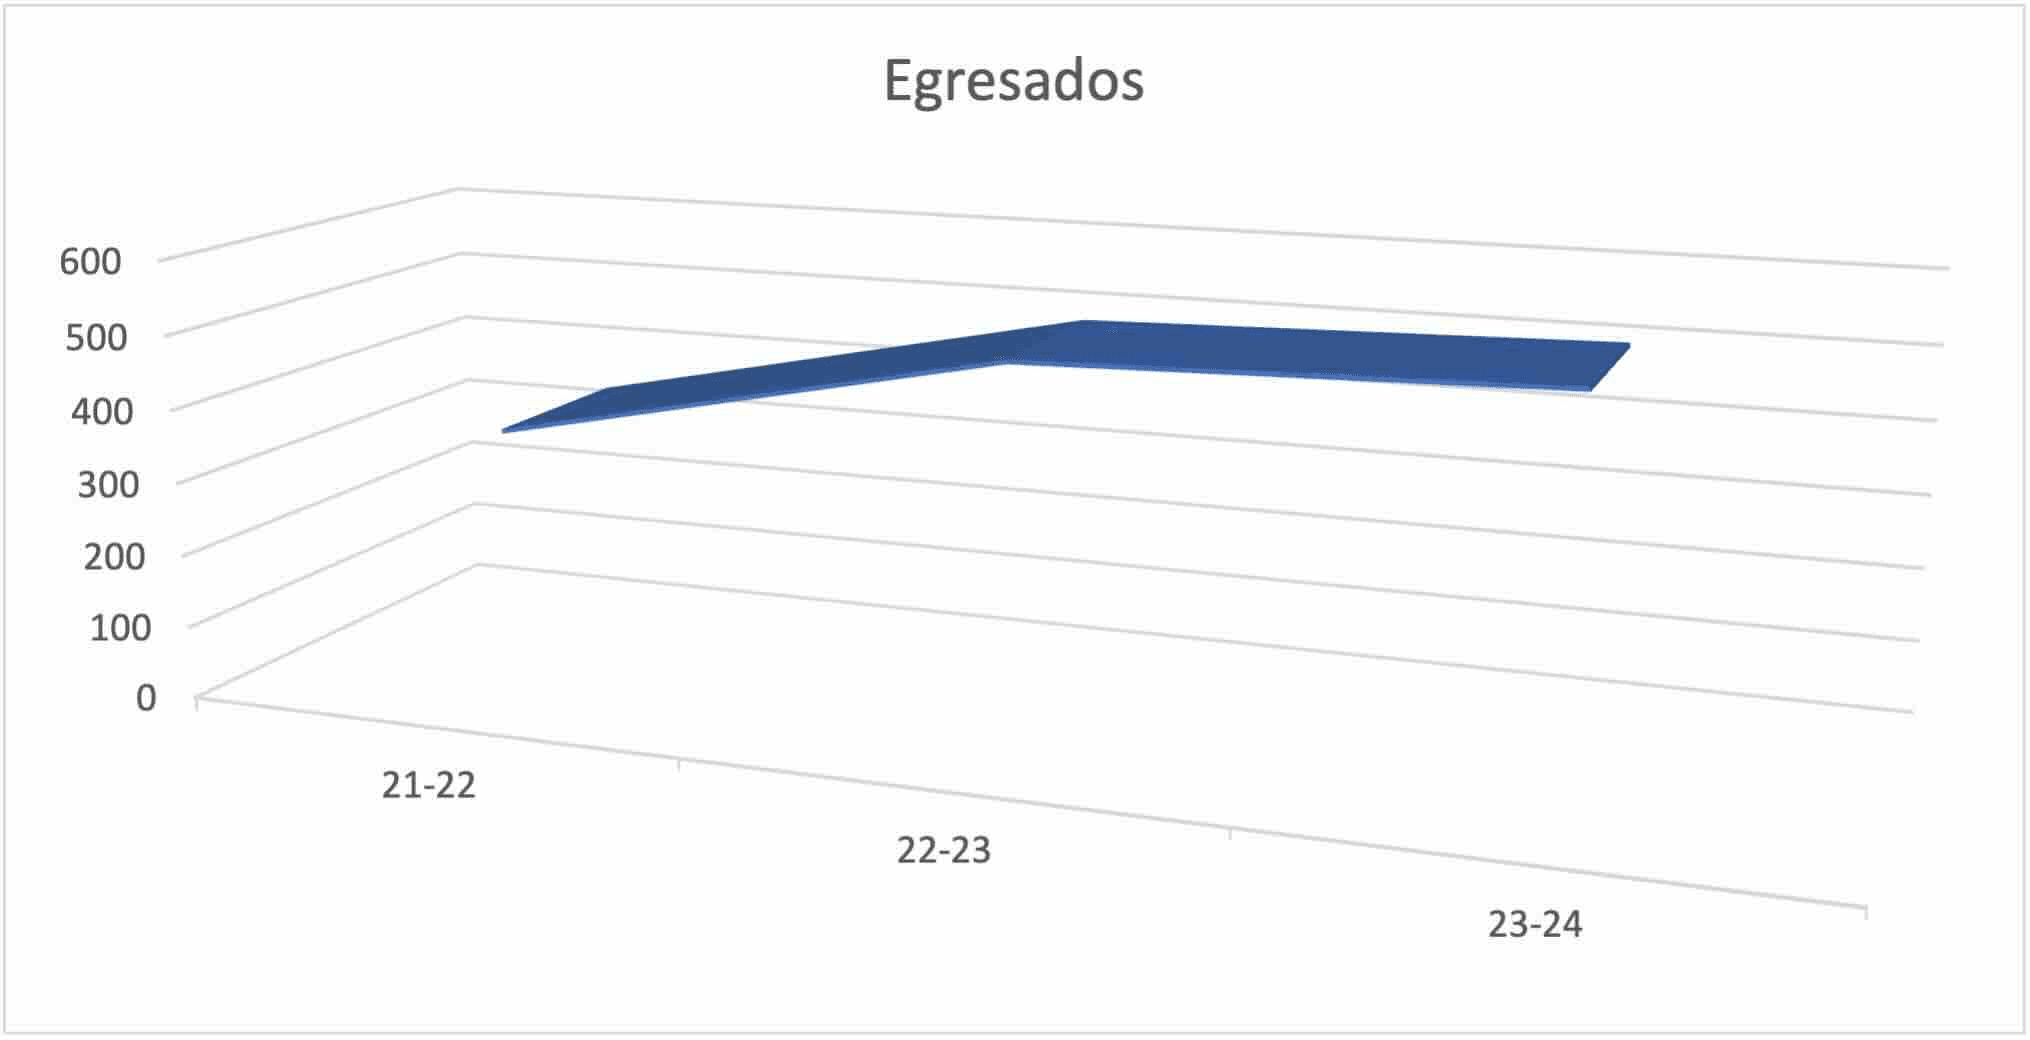
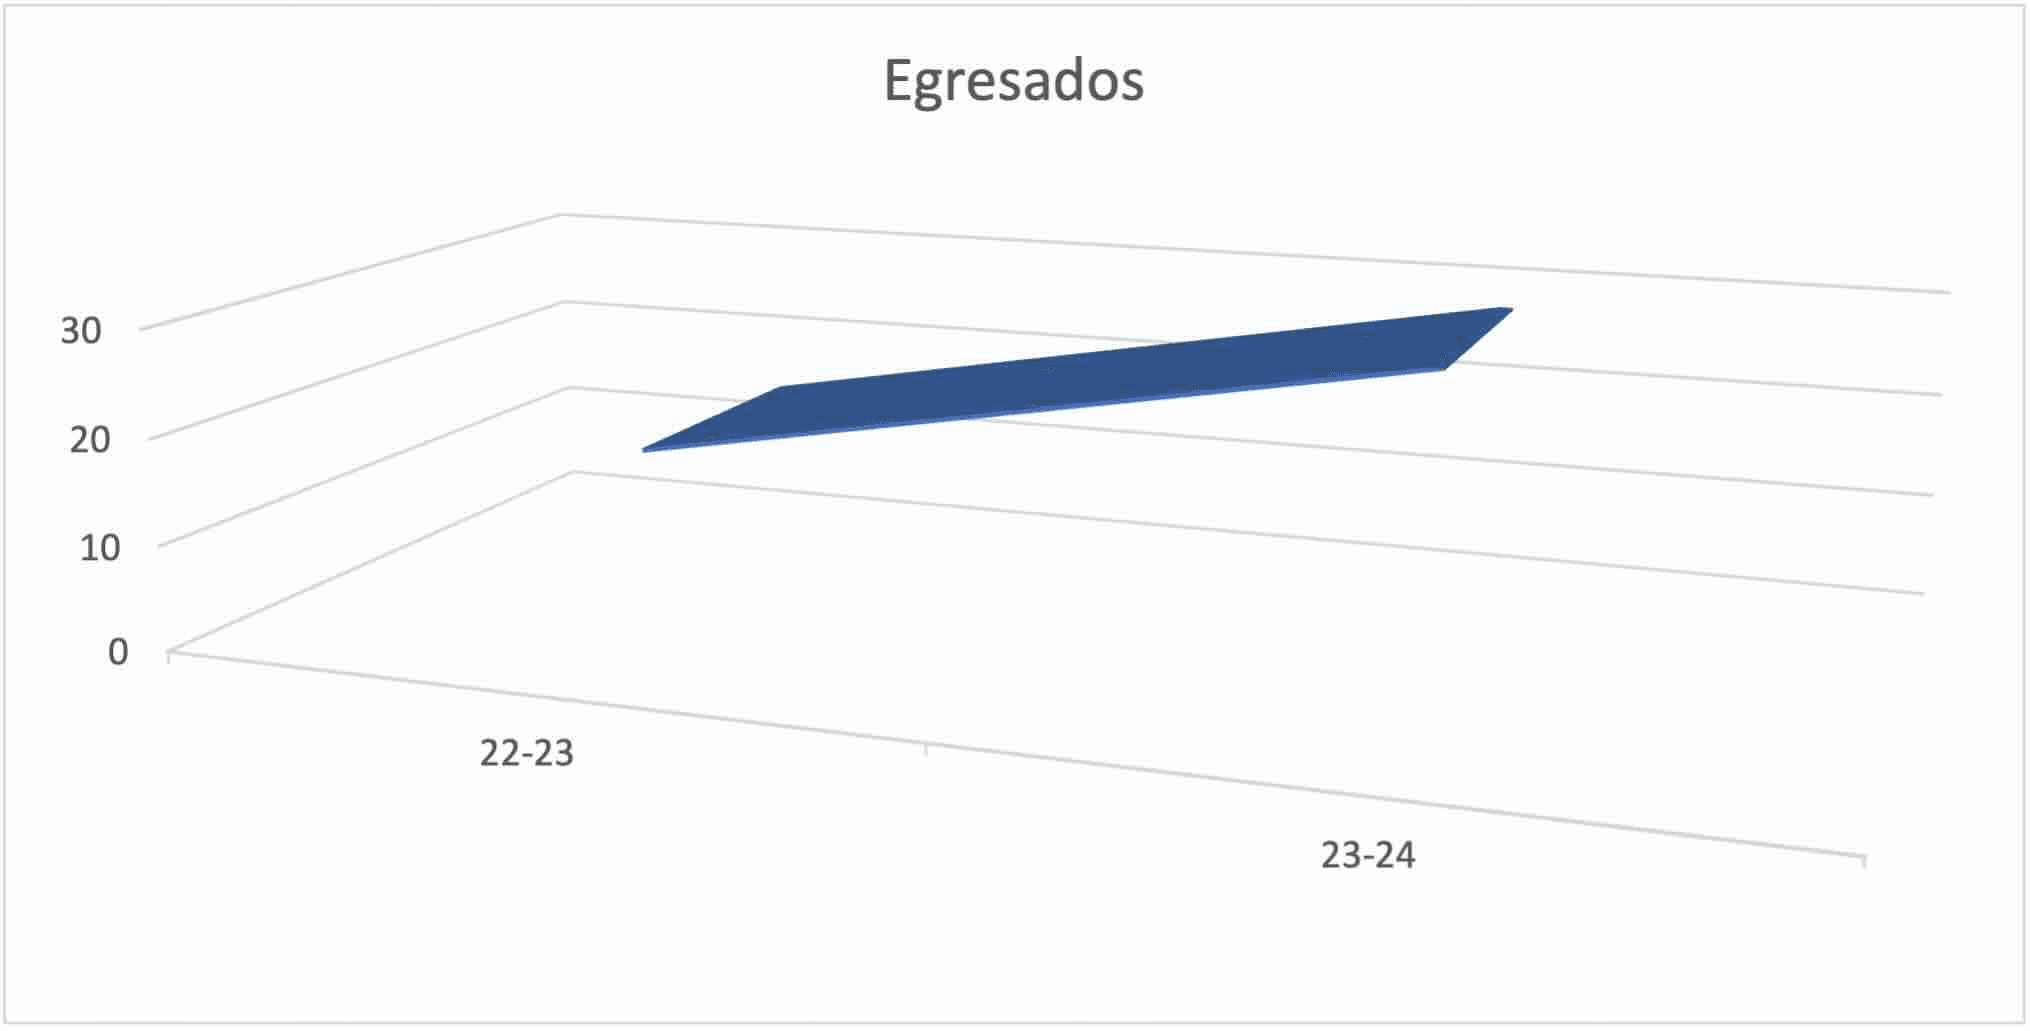
EGRESADOS
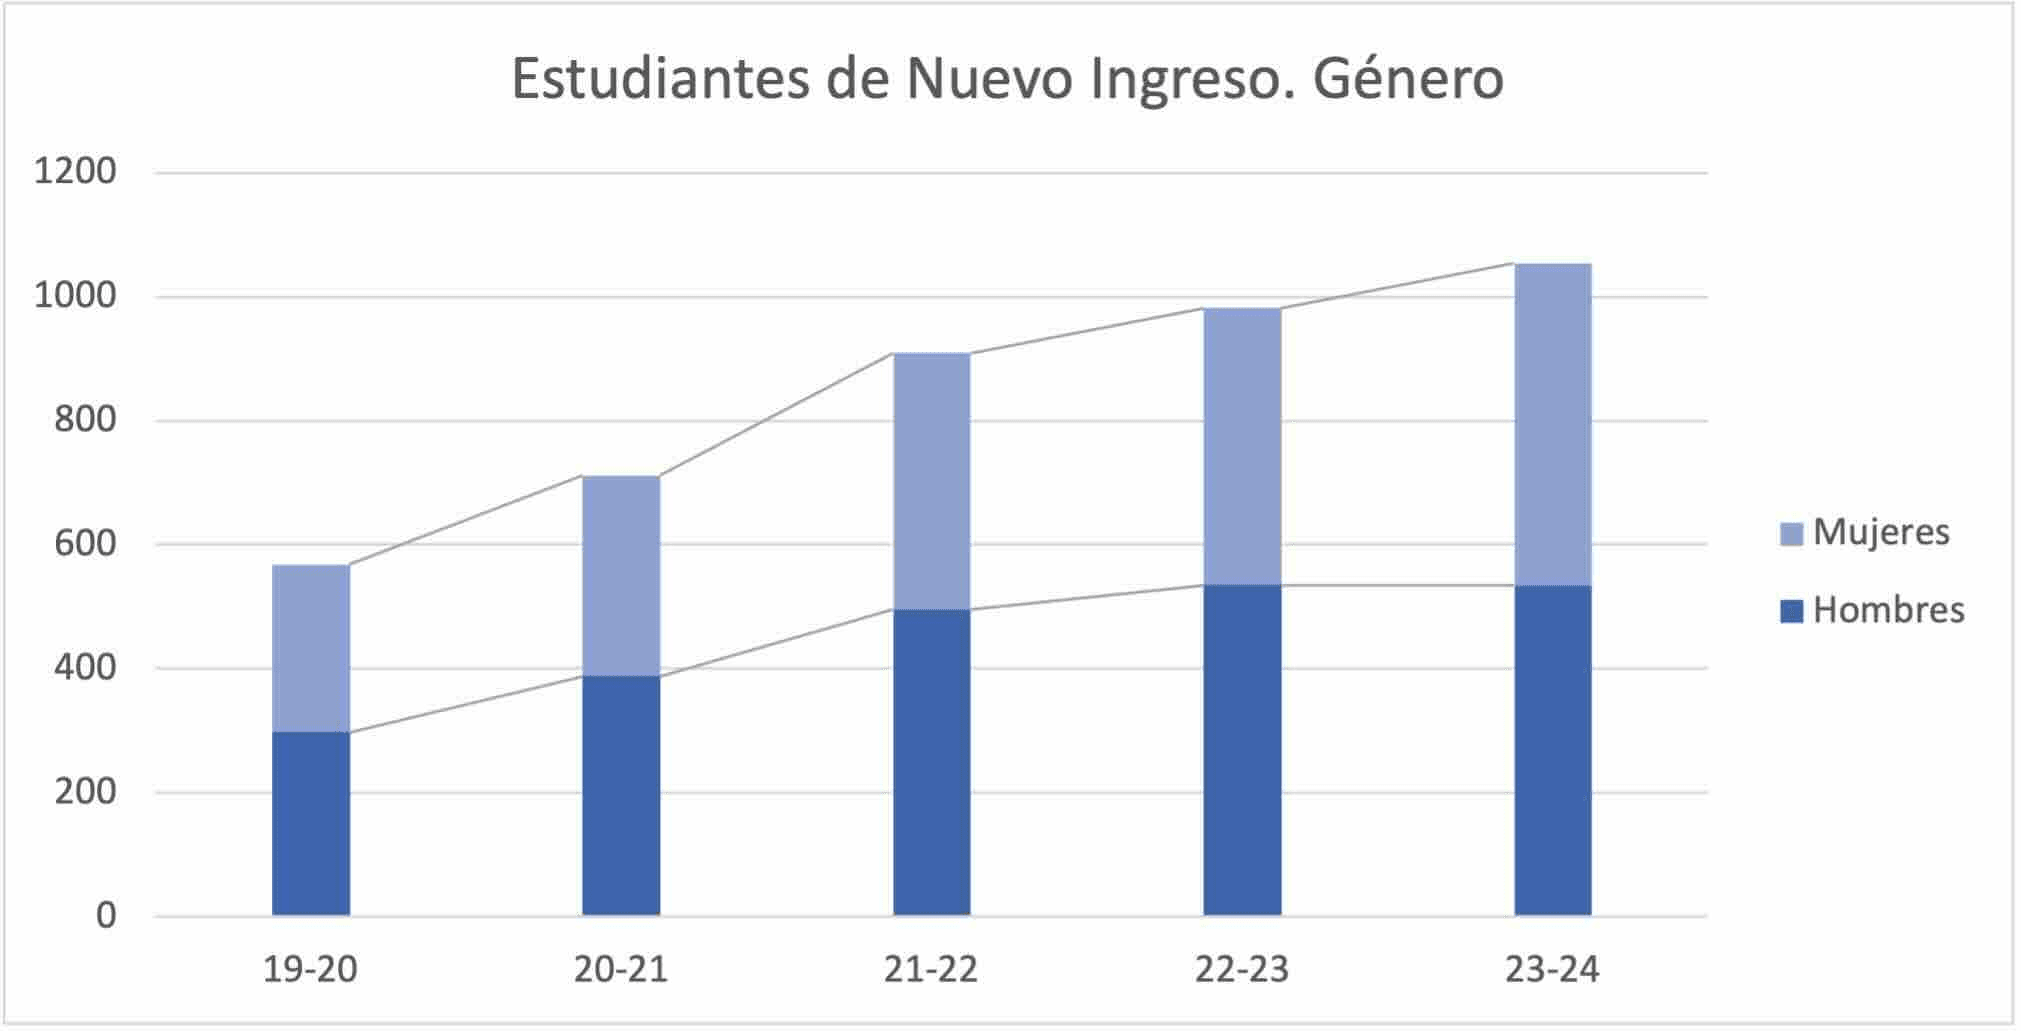
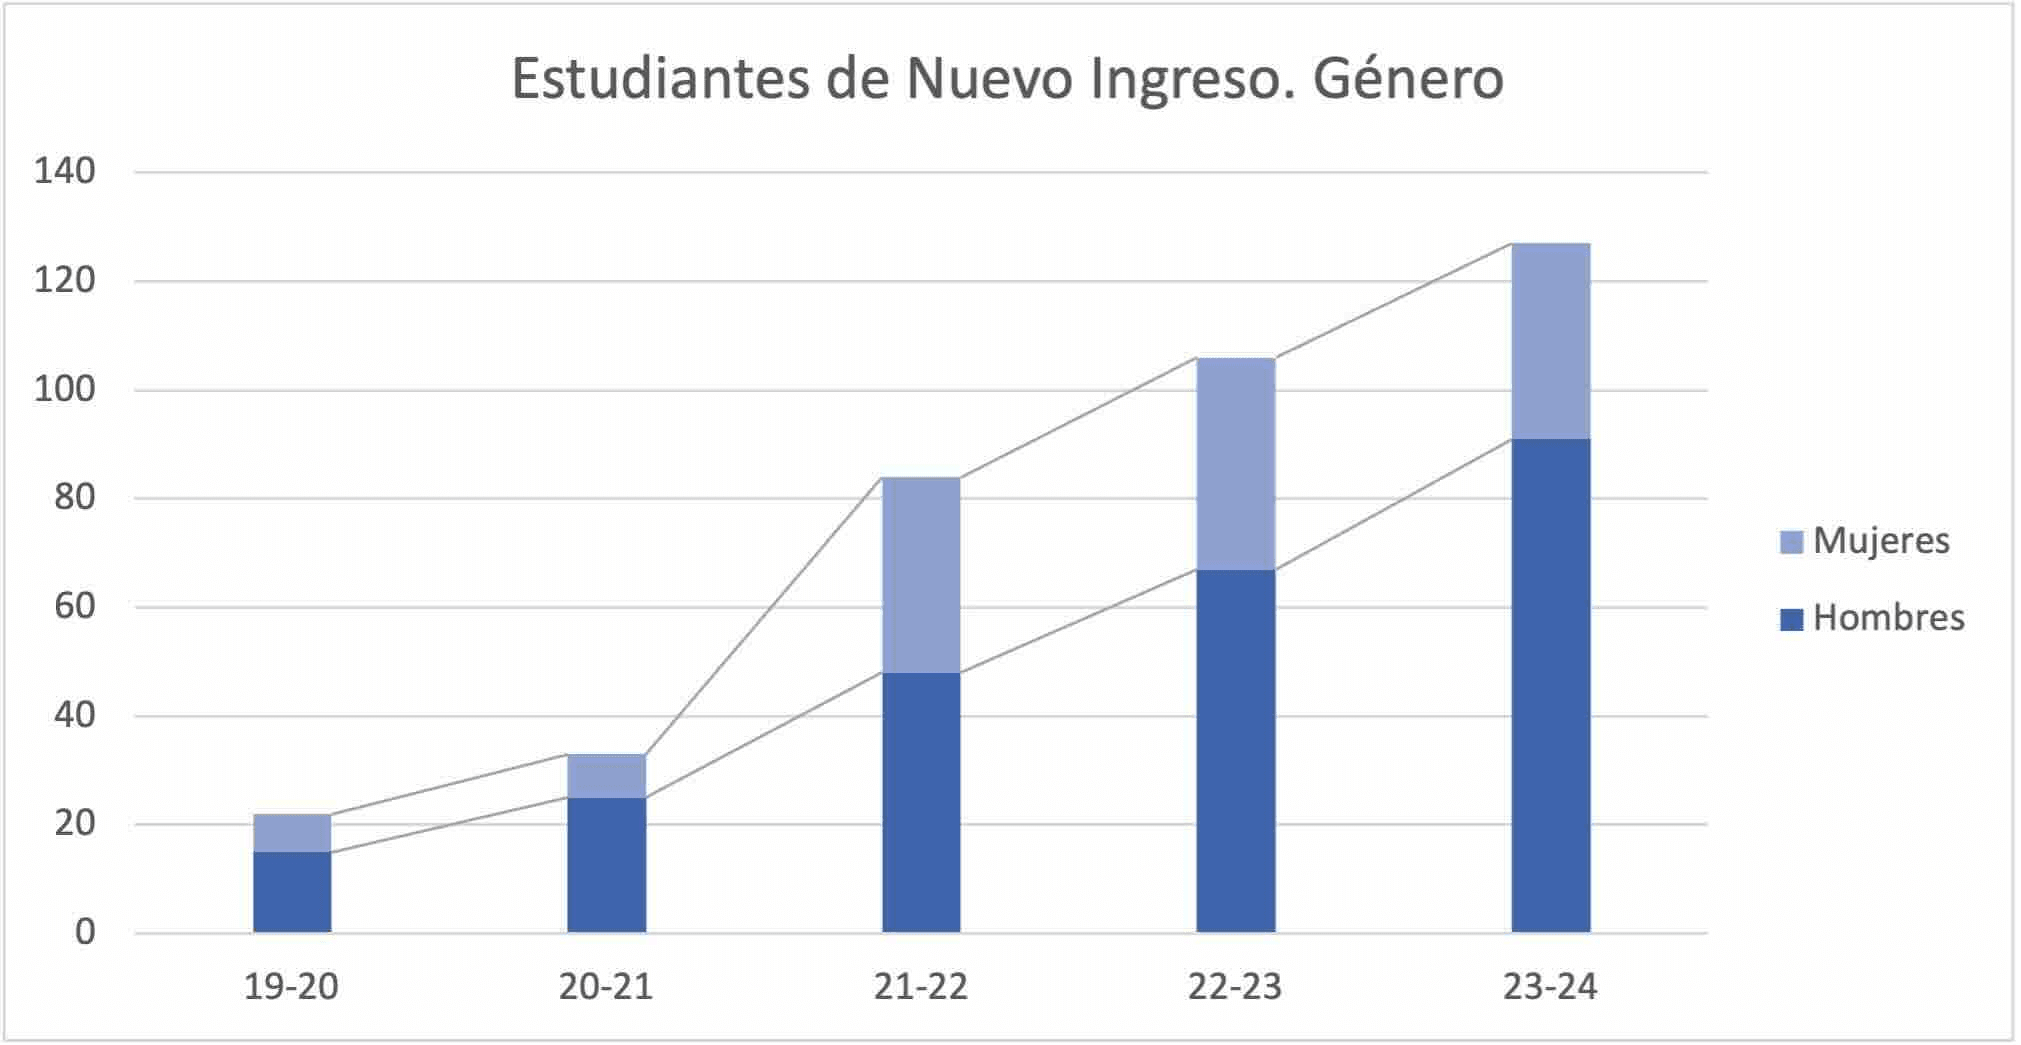
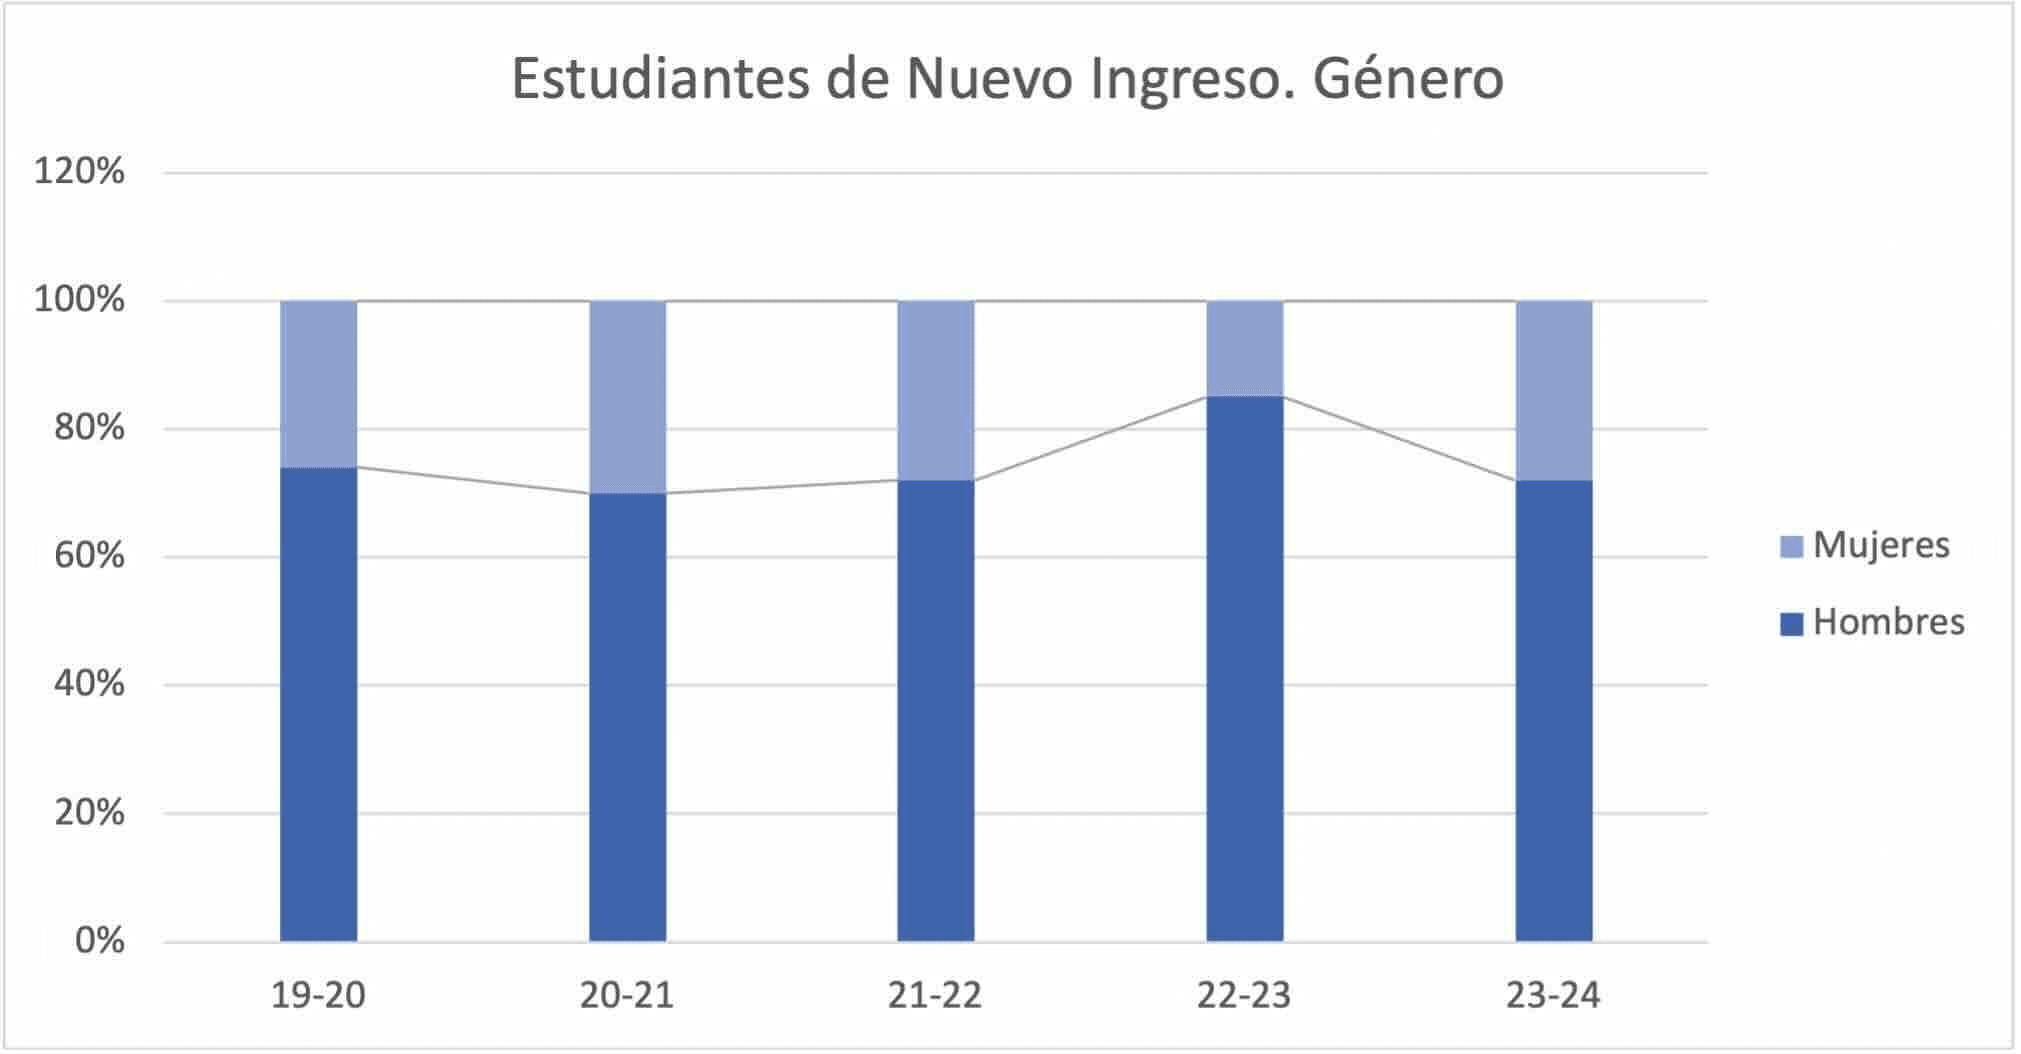
ESTUDIANTES DE NUEVO INGRESO. GÉNERO
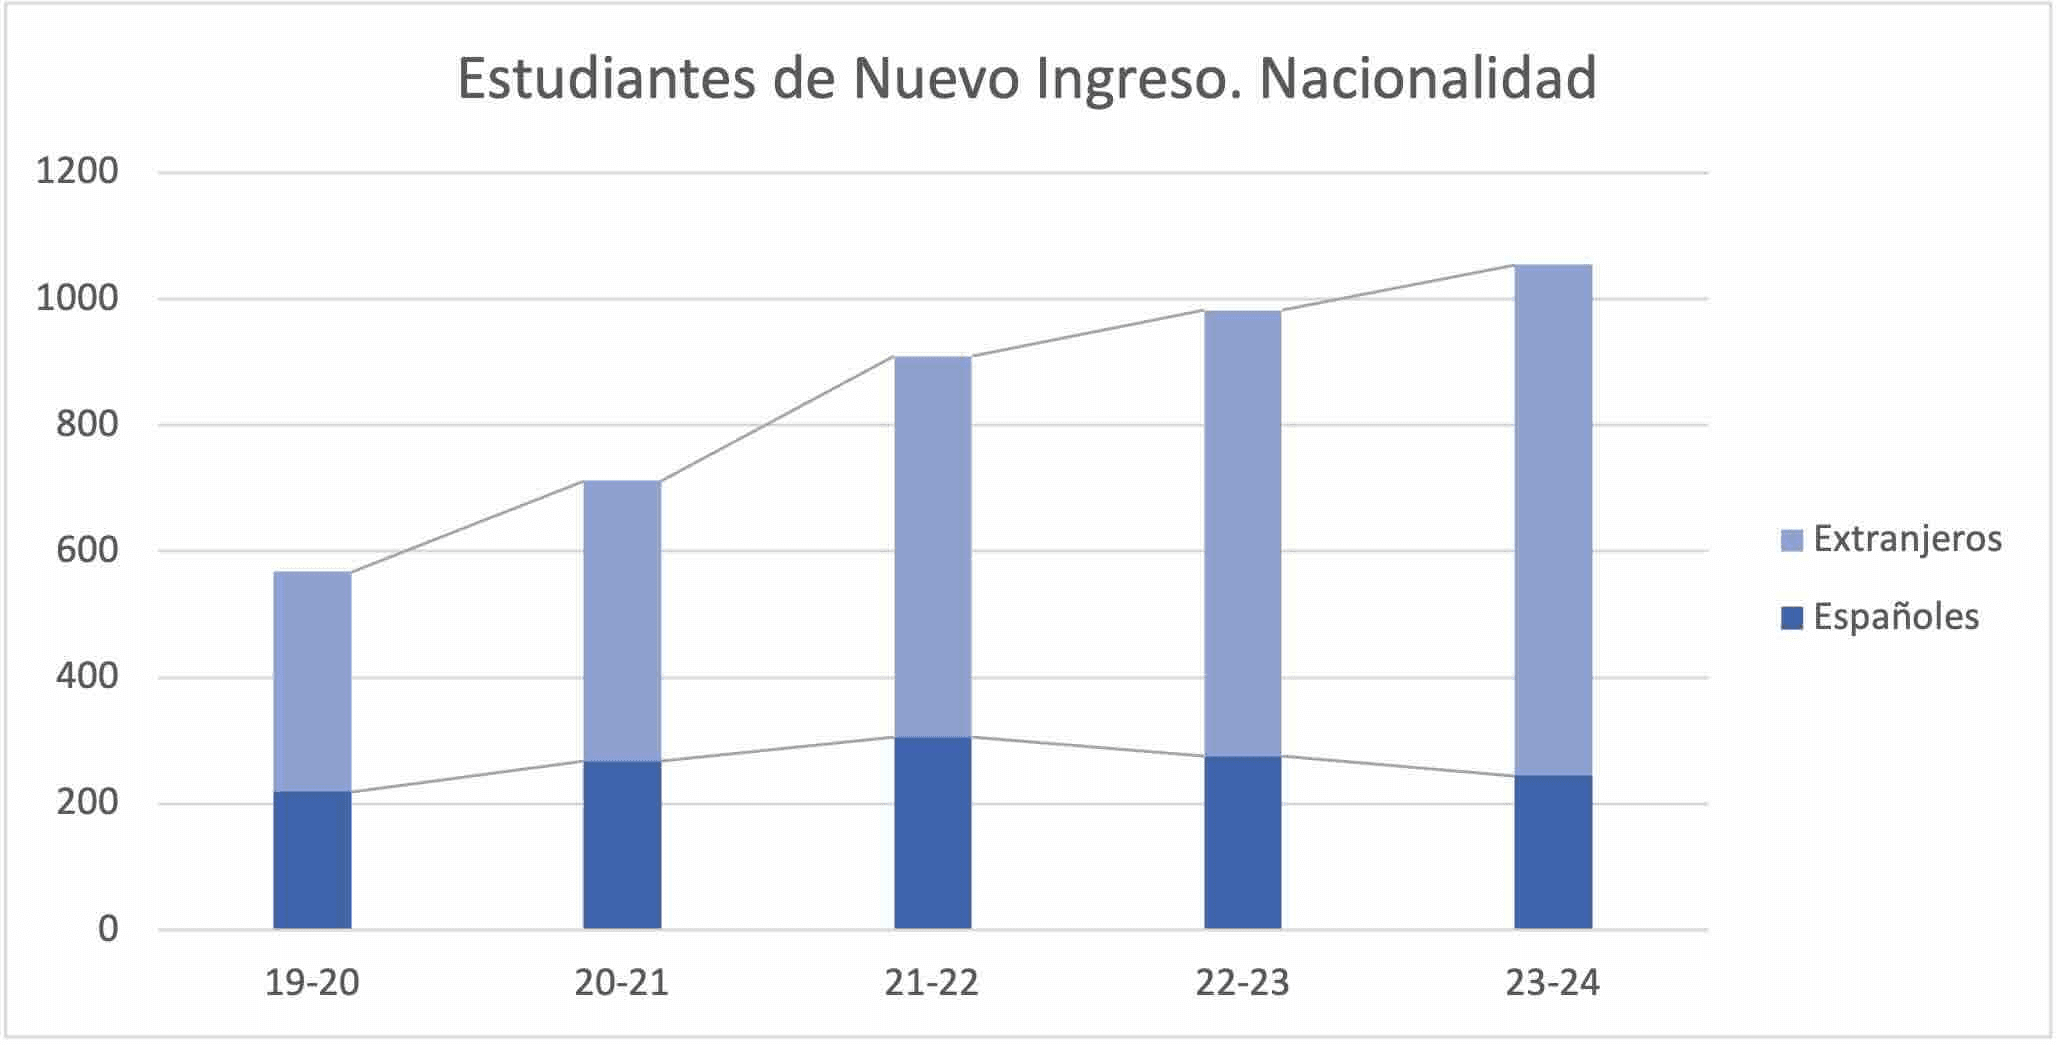
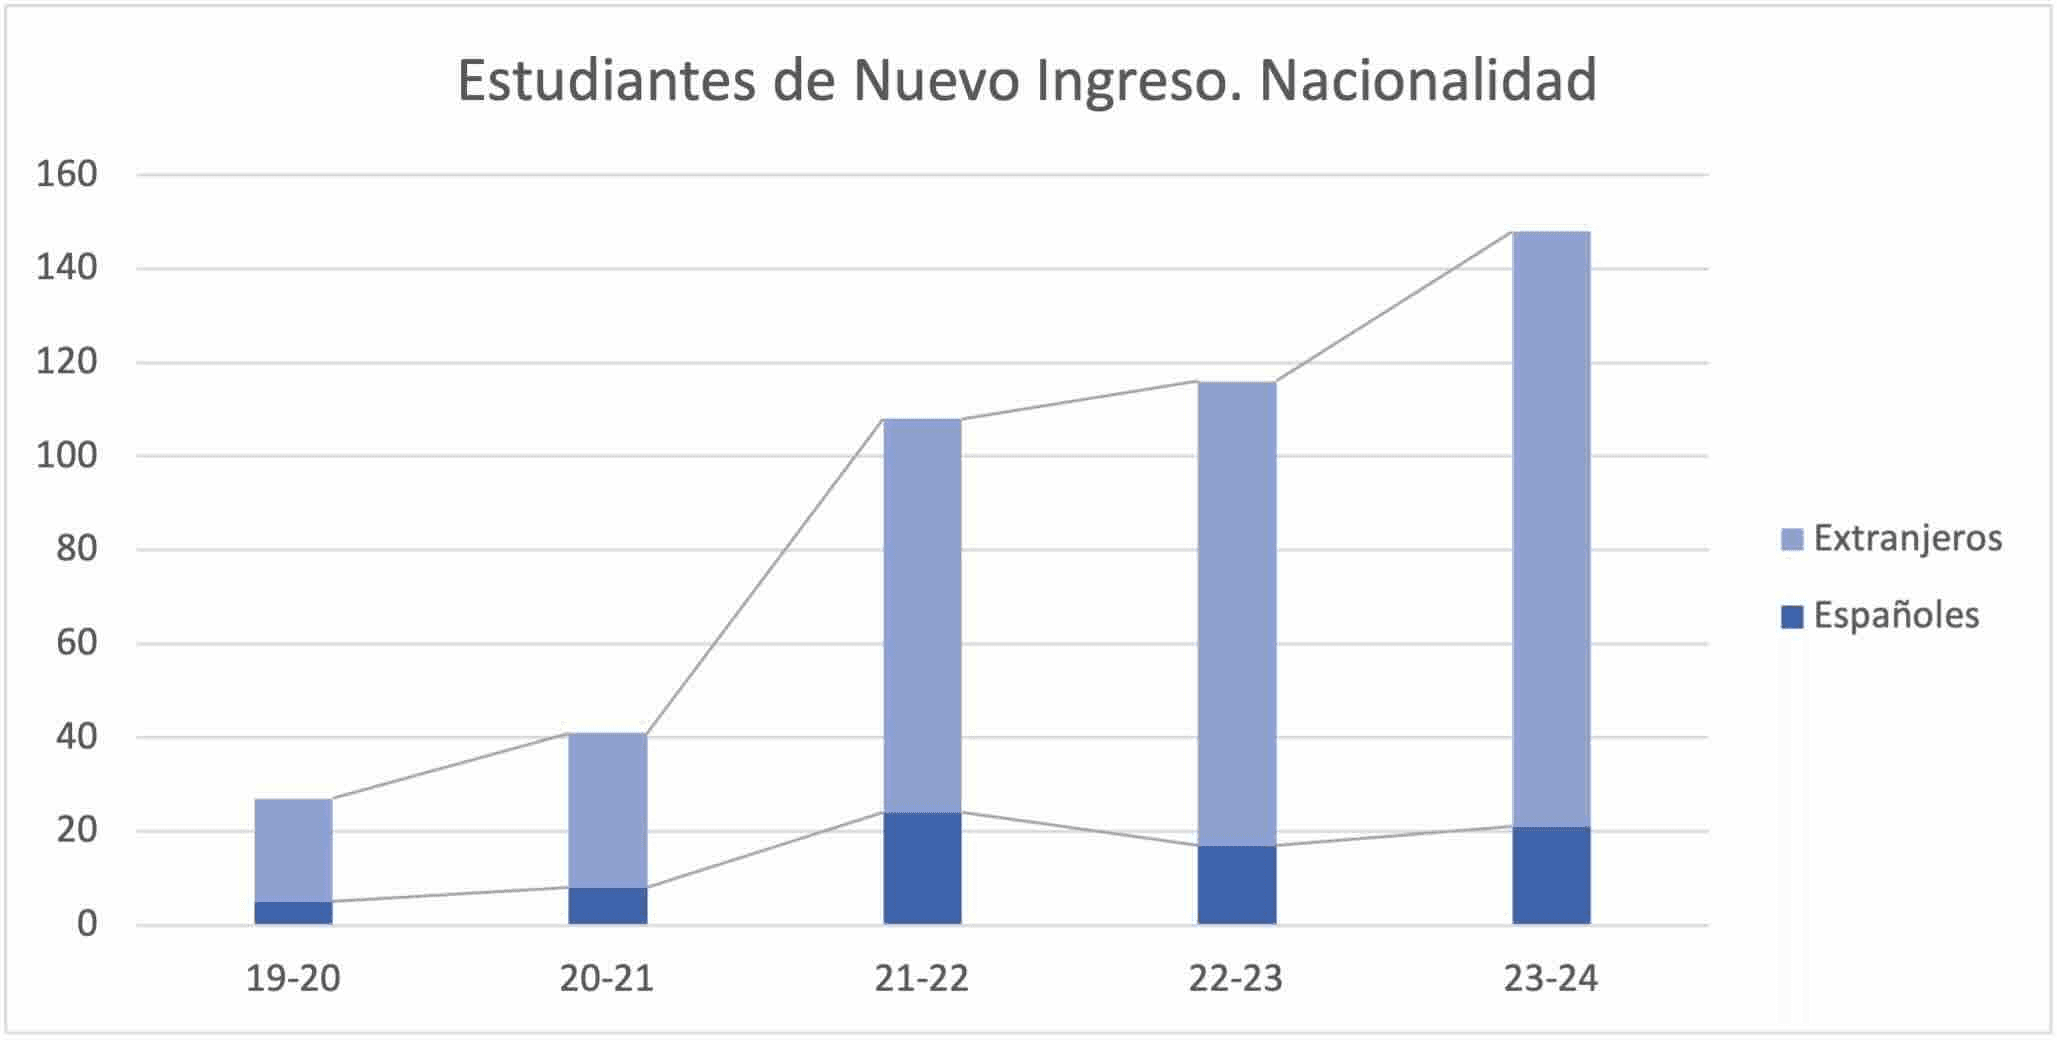
ESTUDIANTES DE NUEVO INGRESO. NACIONALIDAD
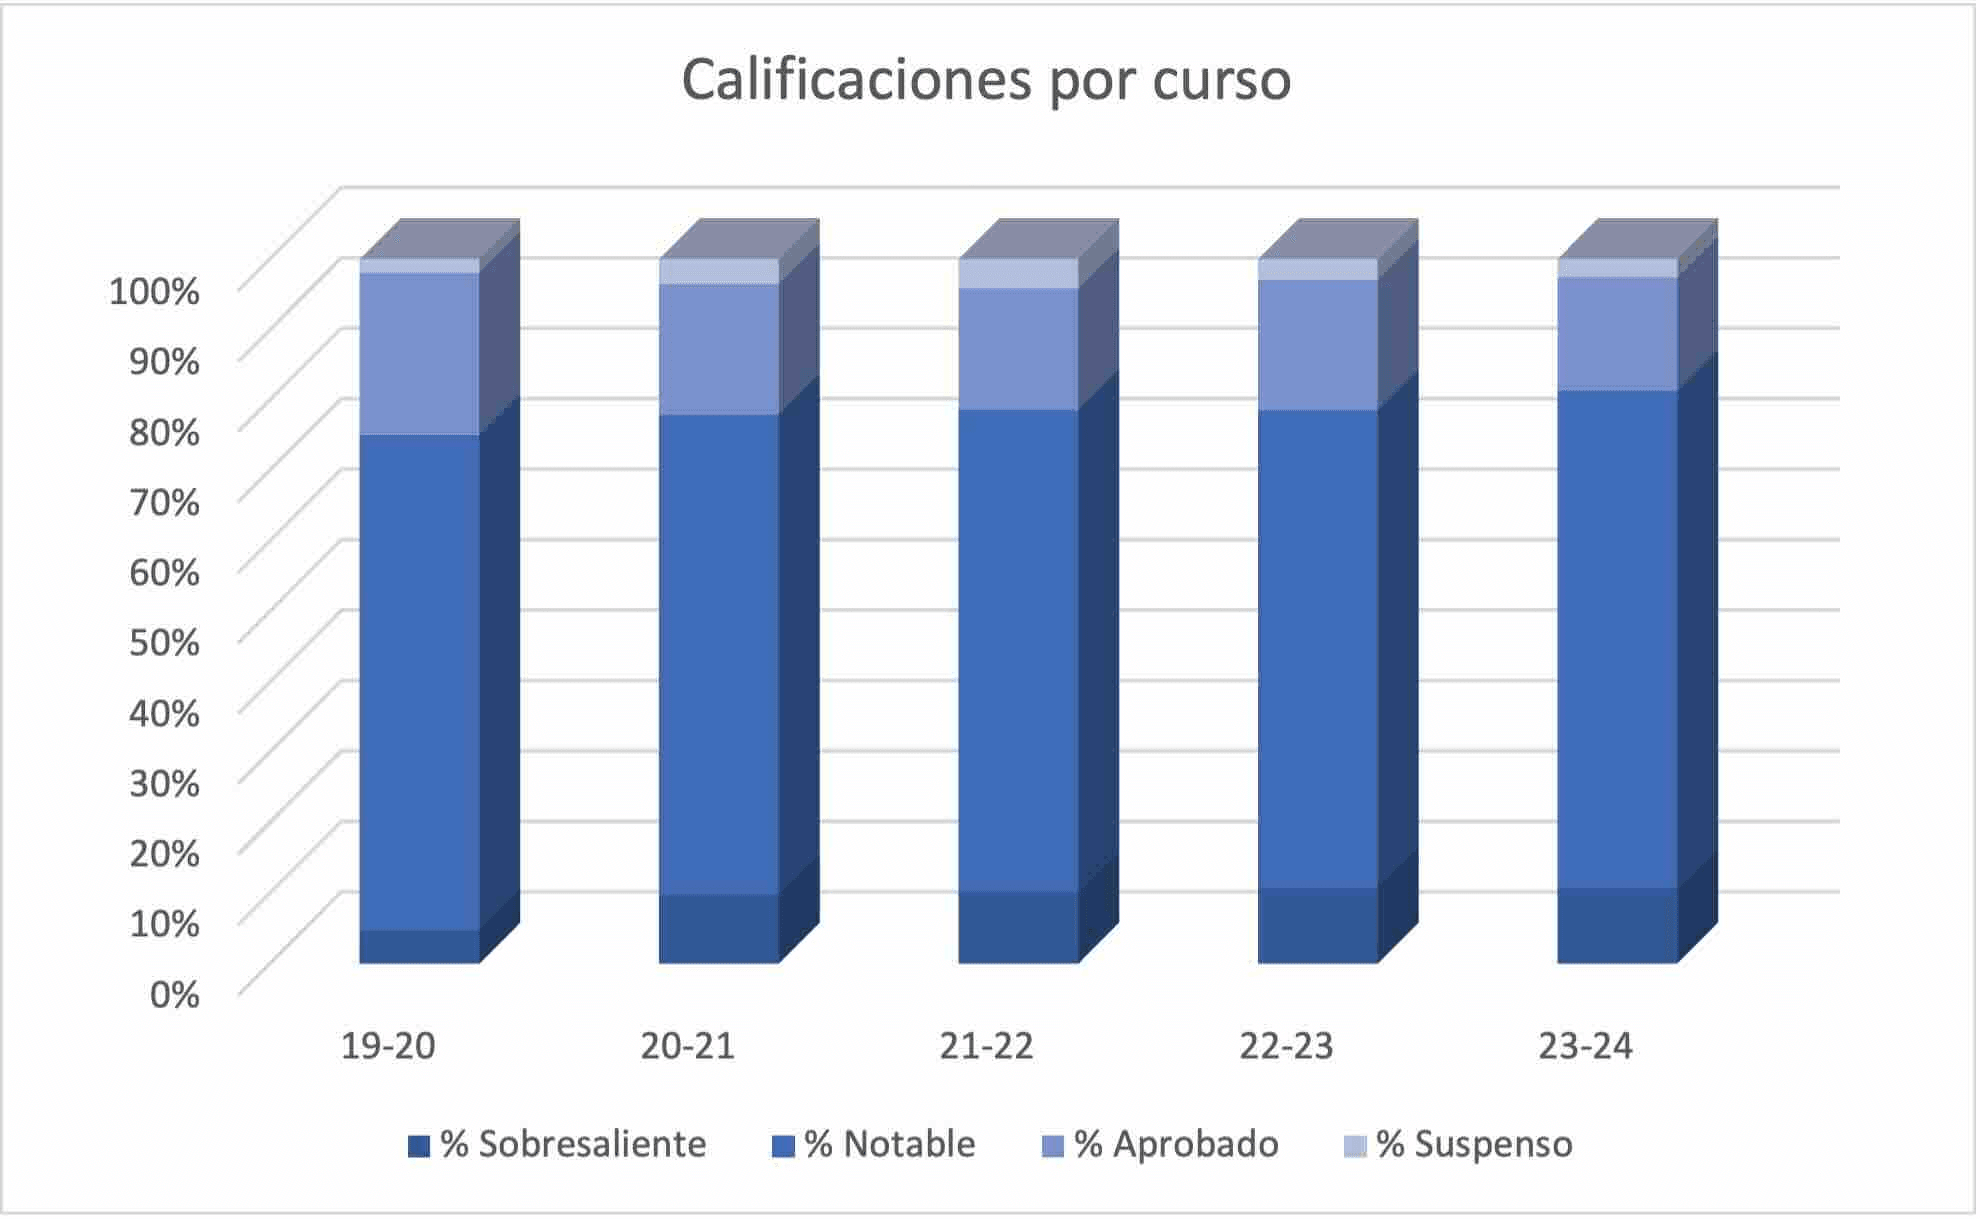
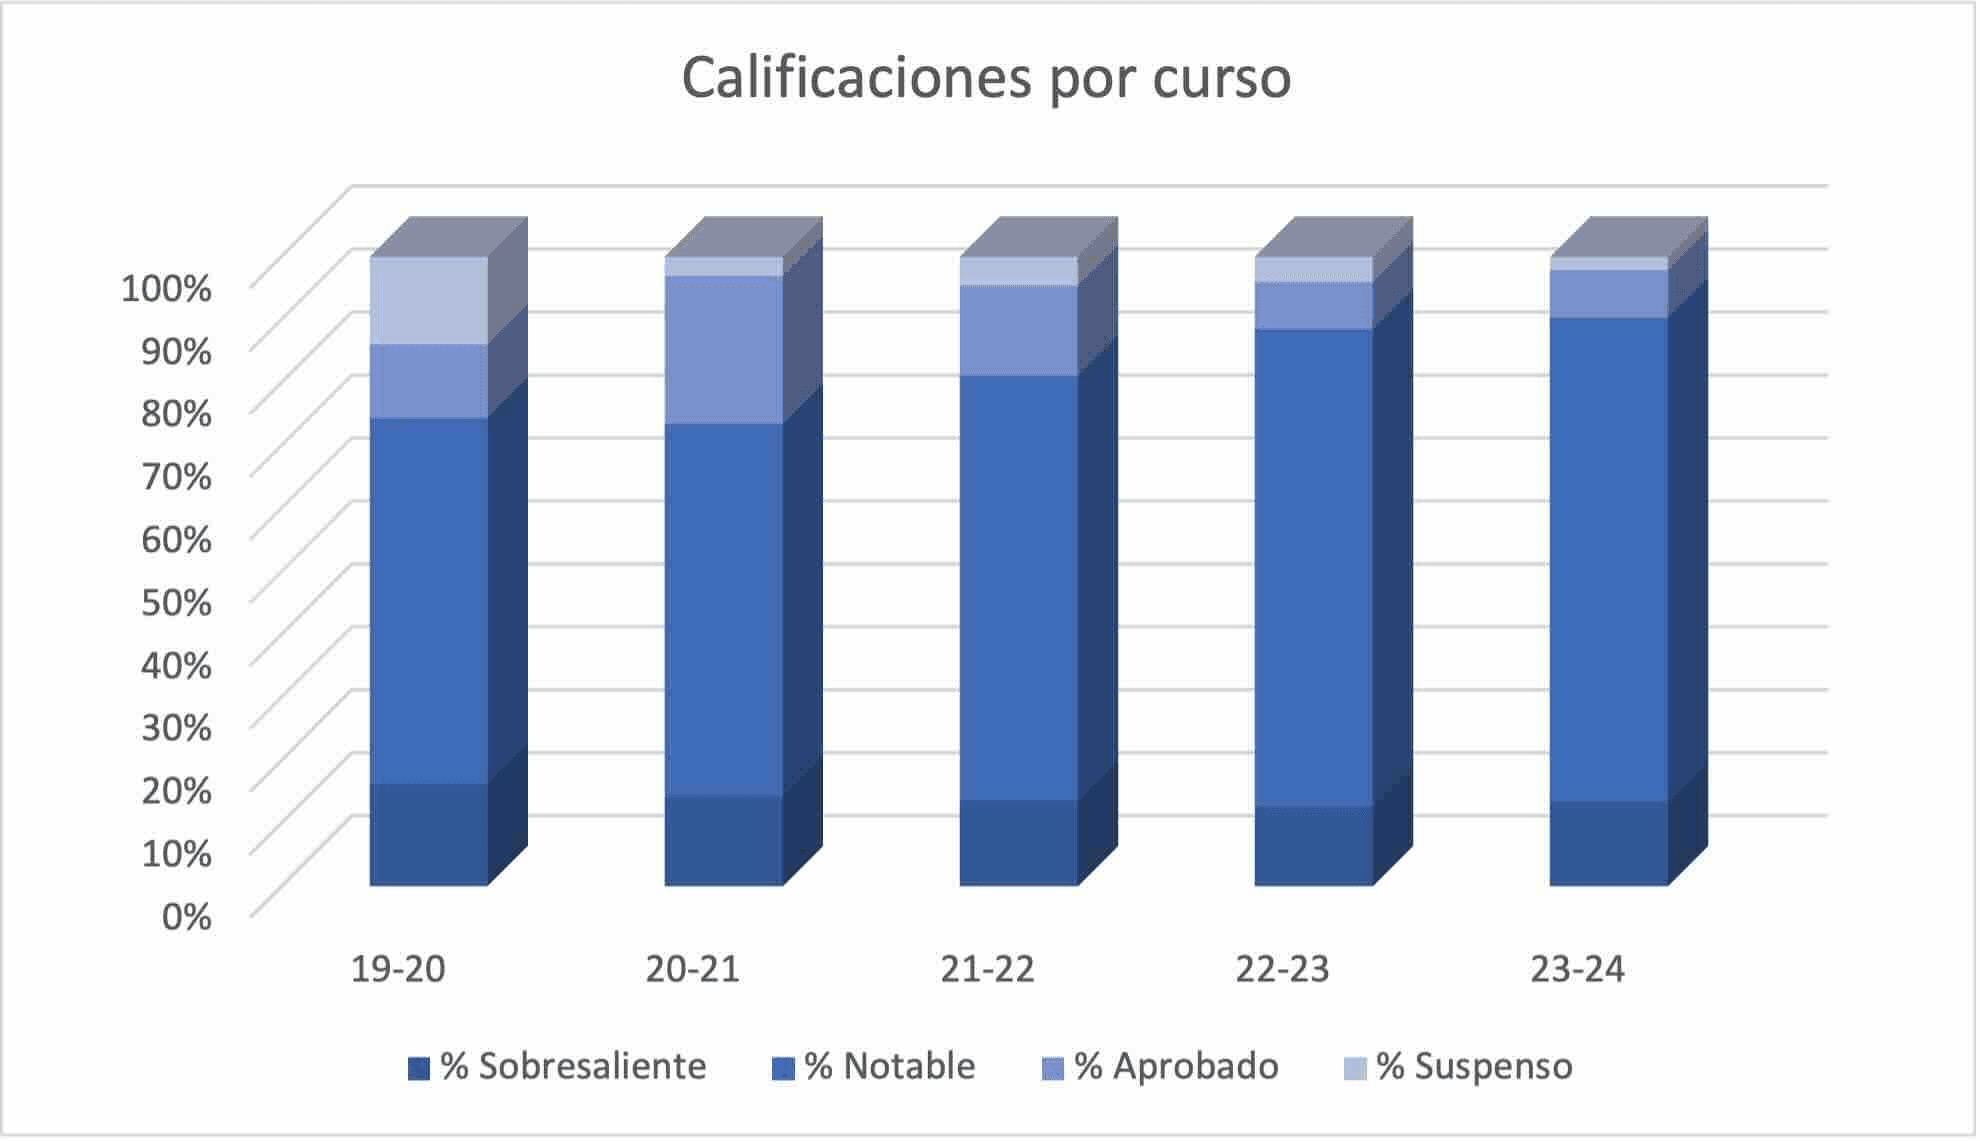
CALIFICACIONES POR CURSO
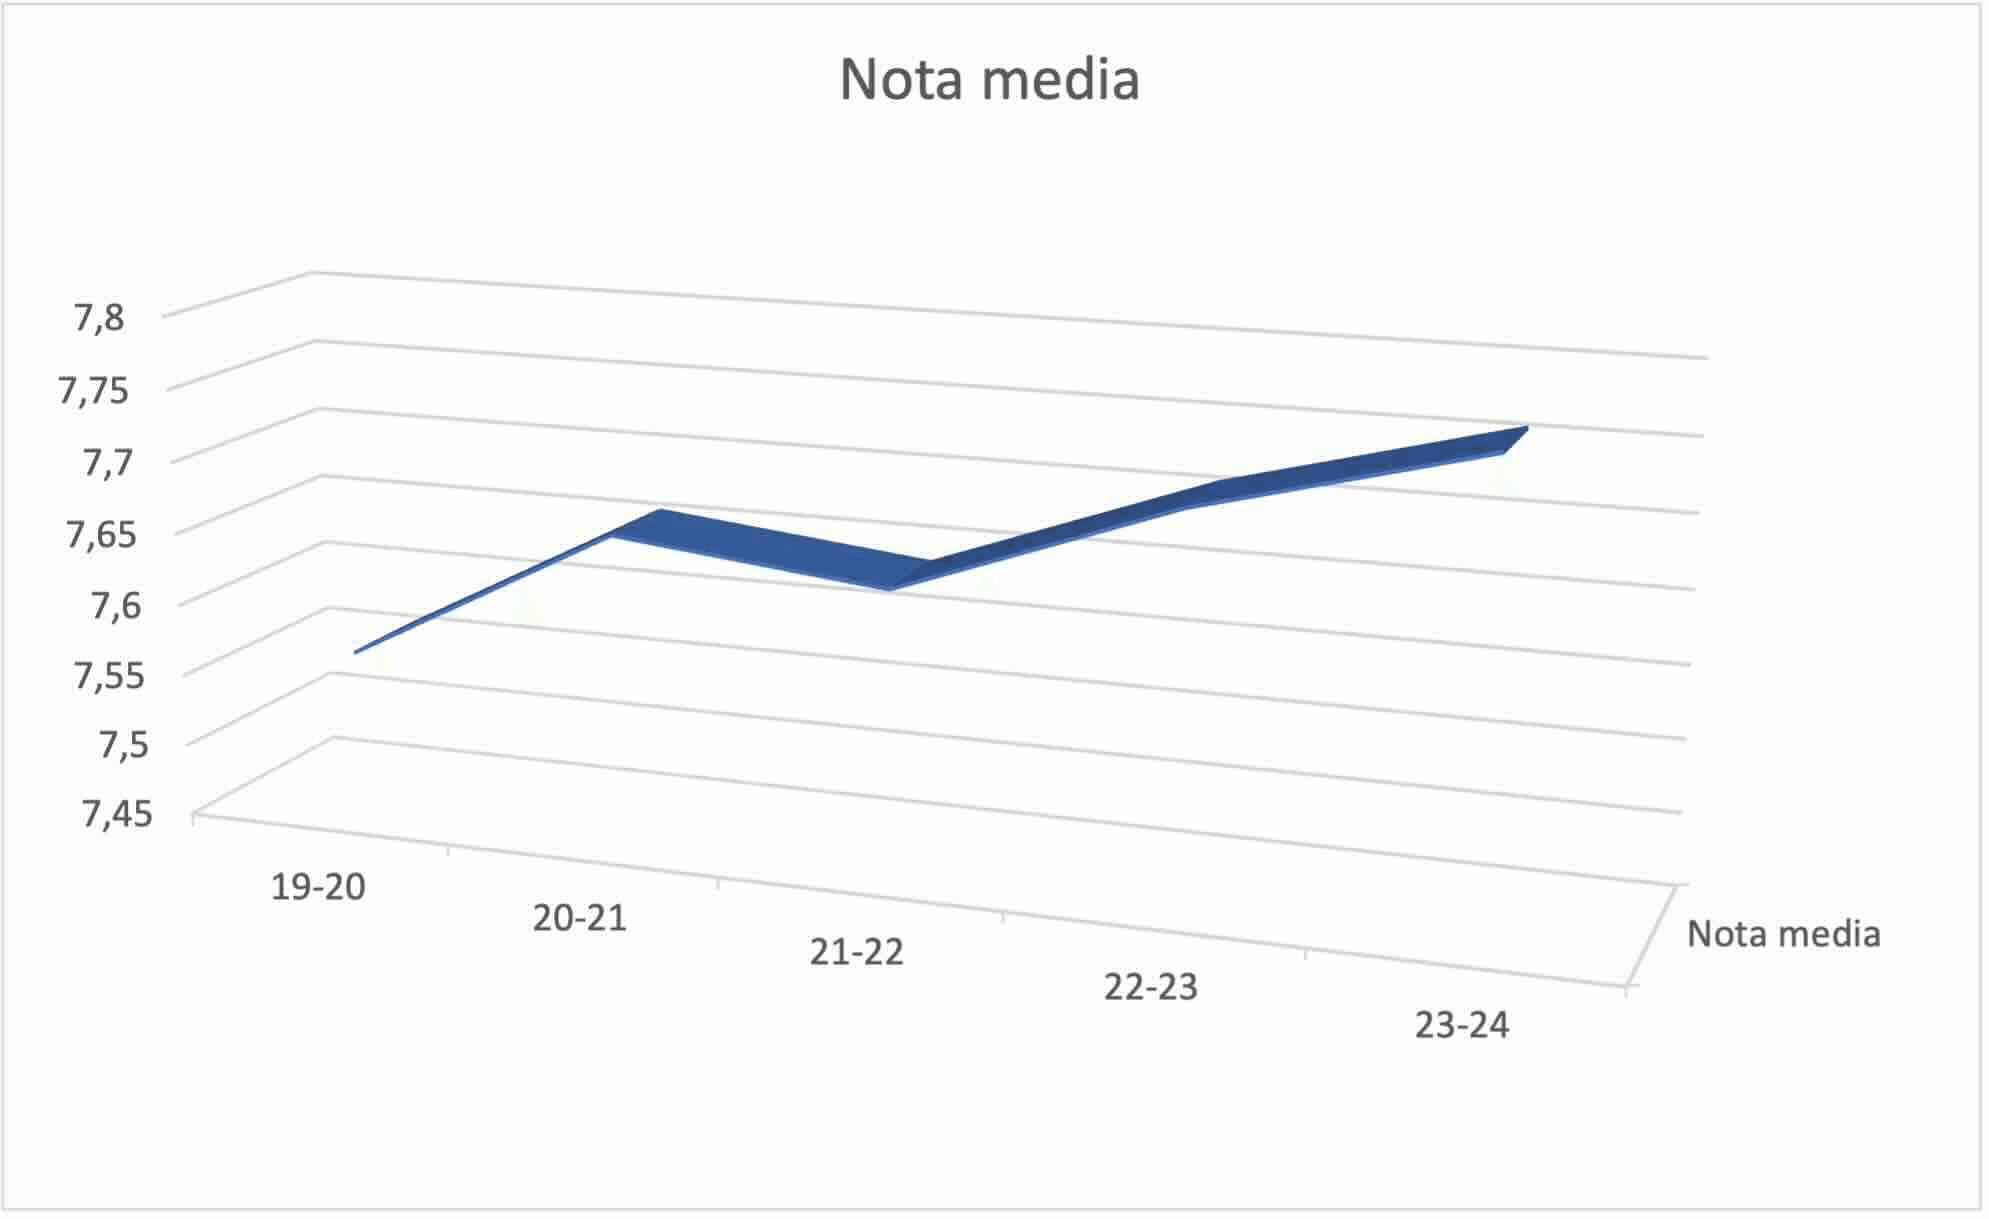
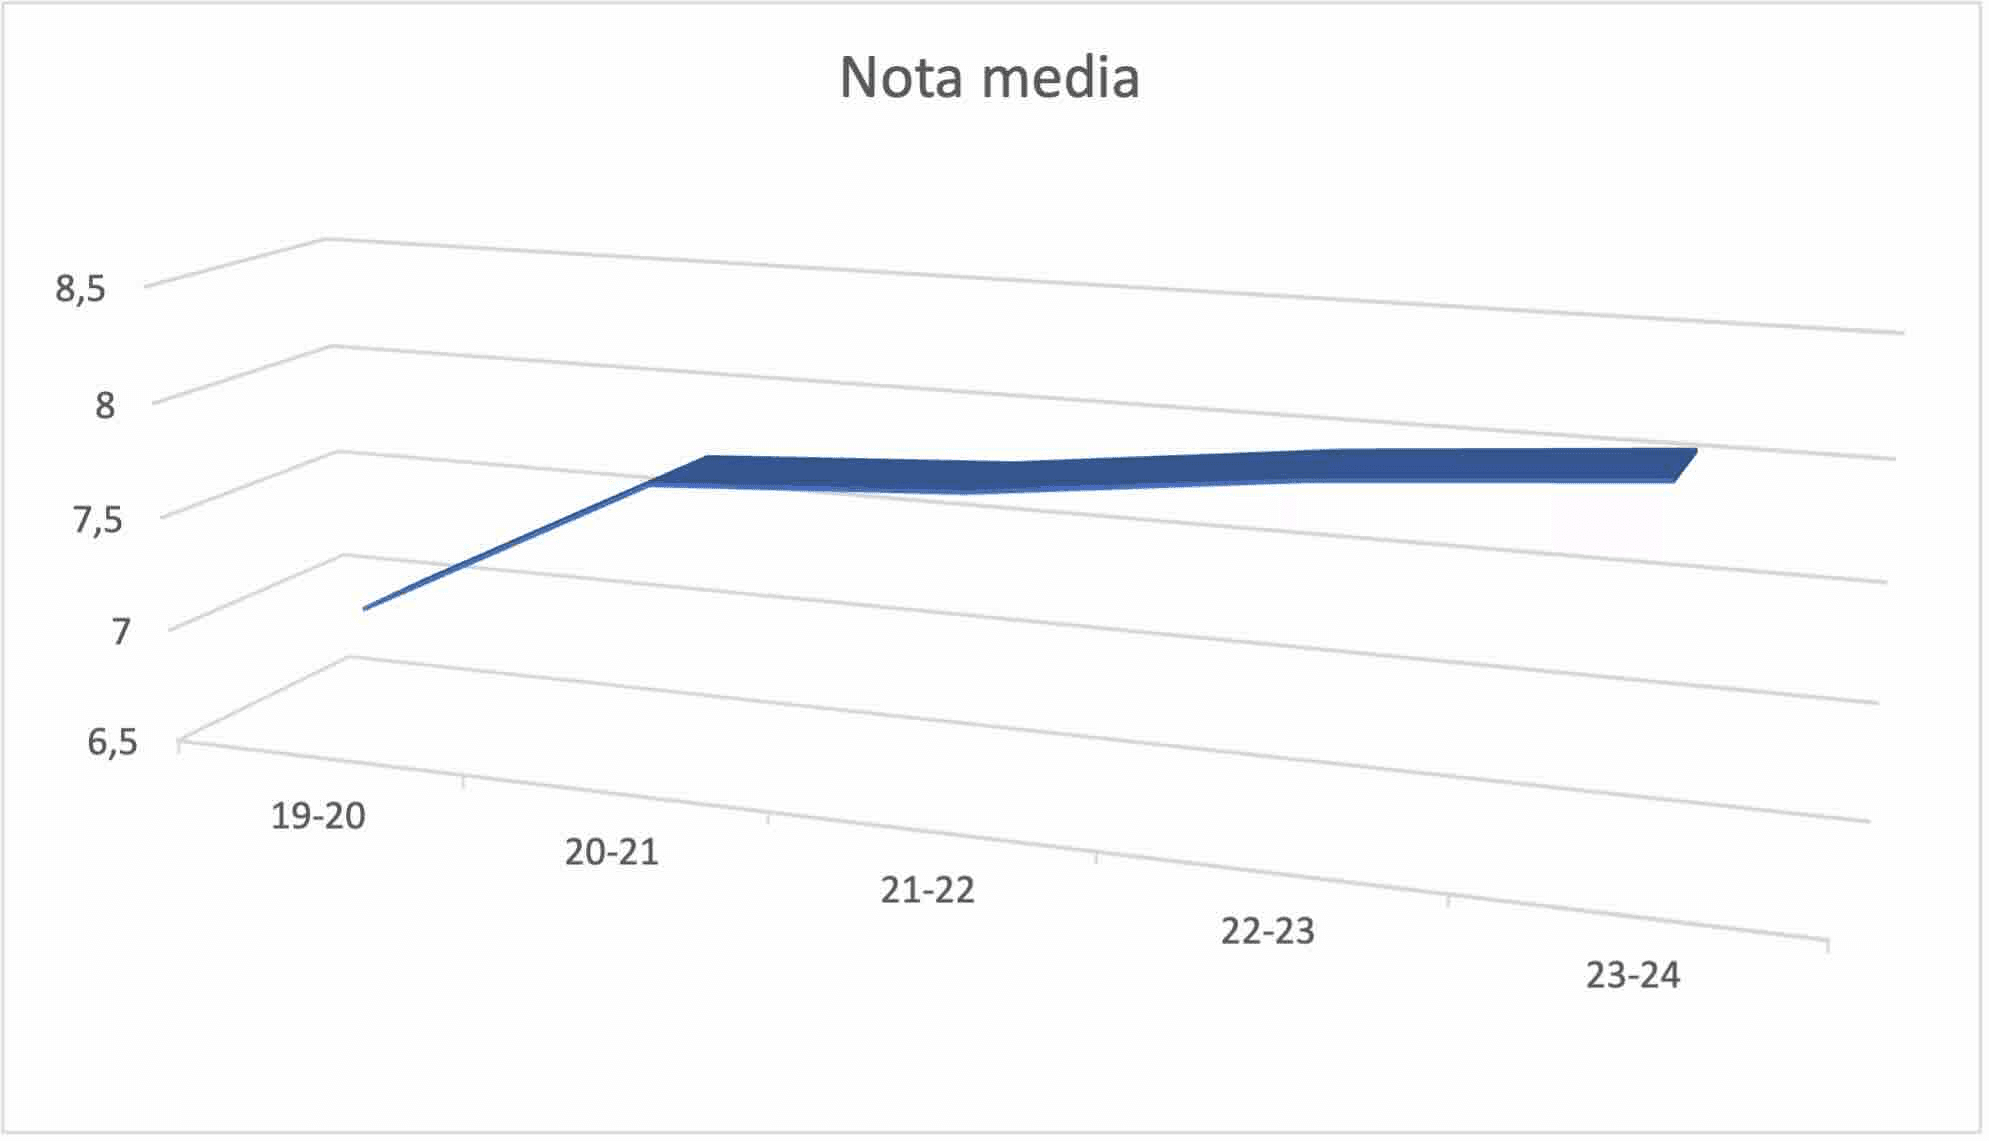
NOTA MEDIA
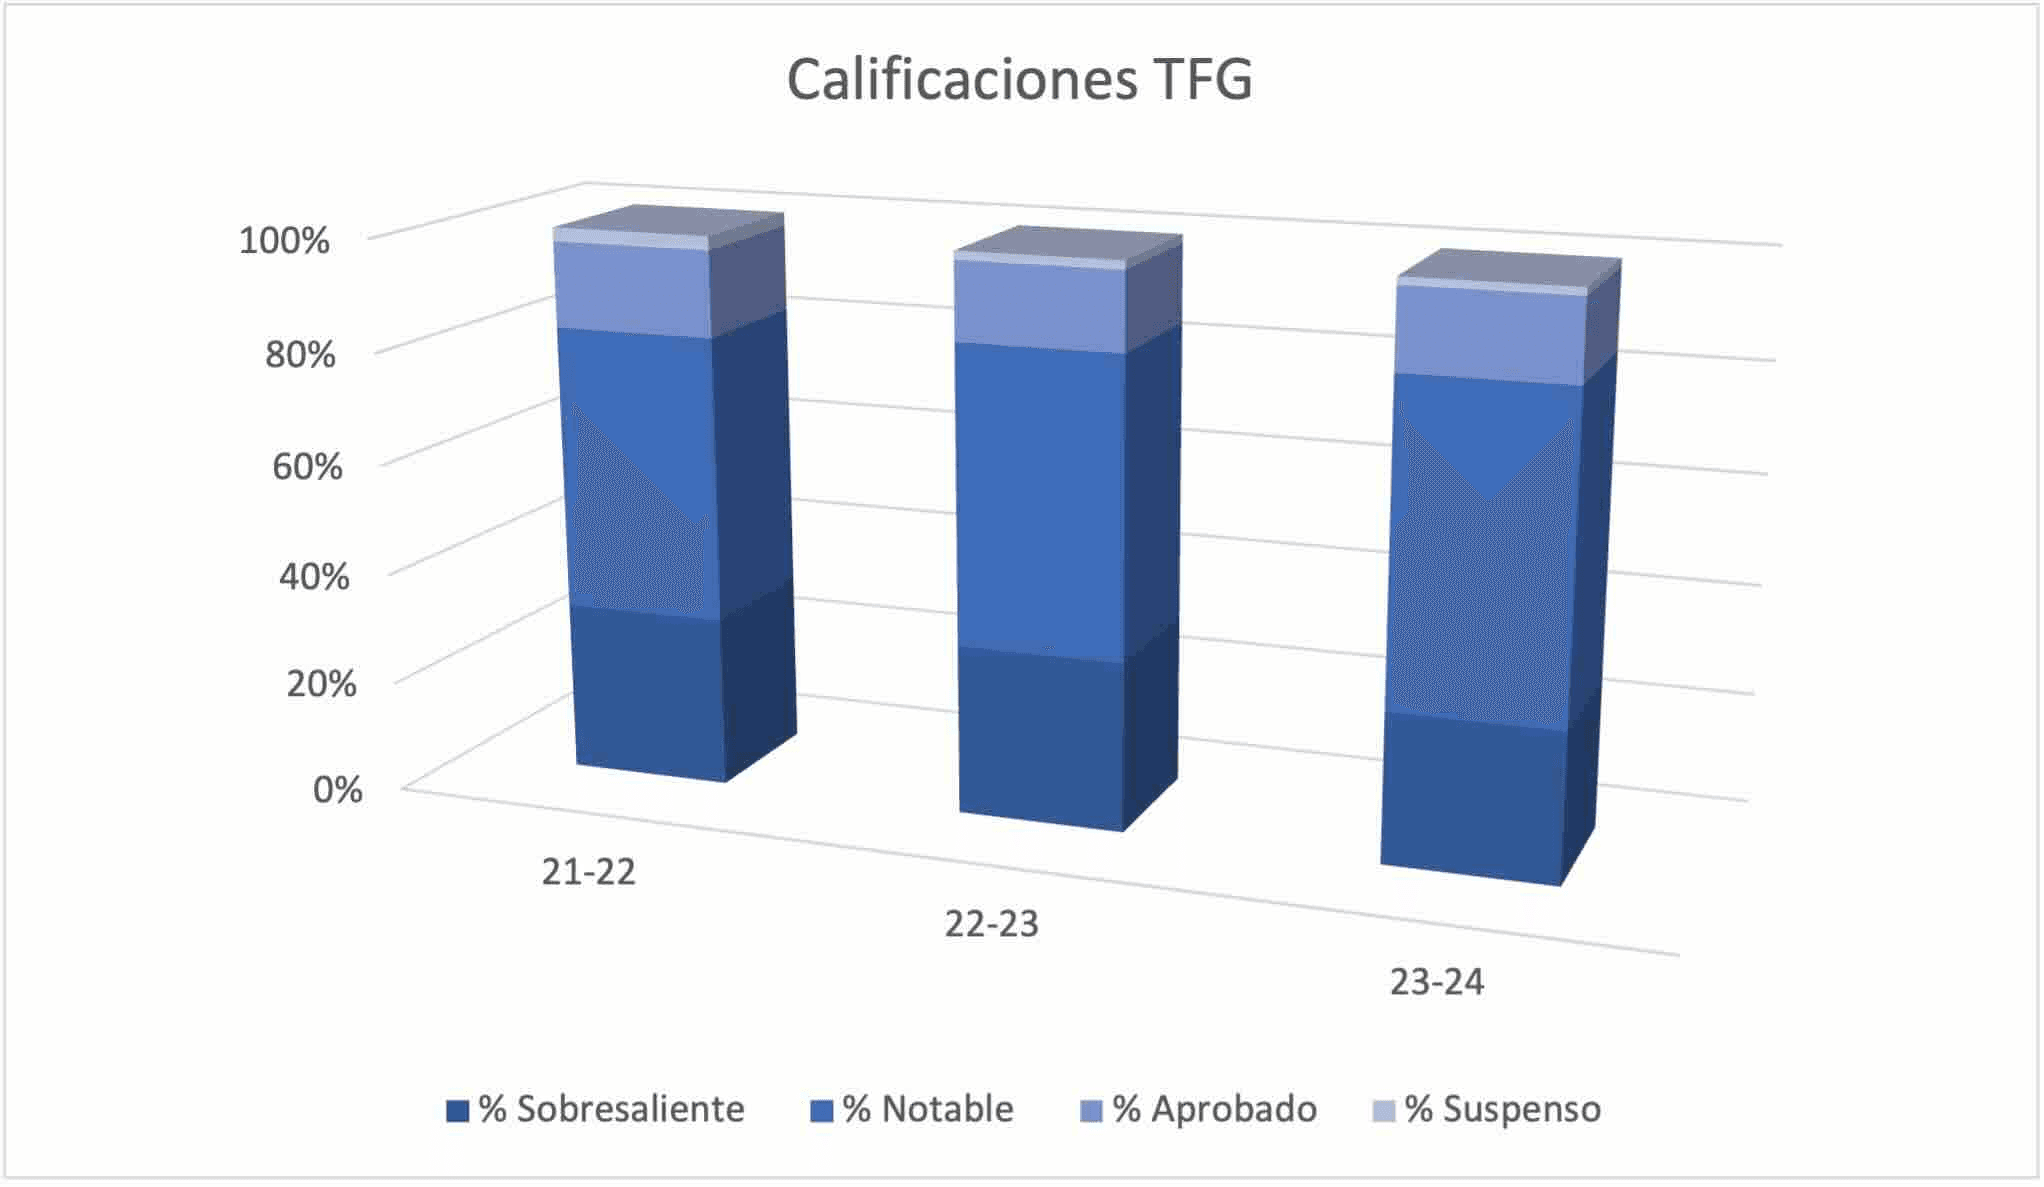
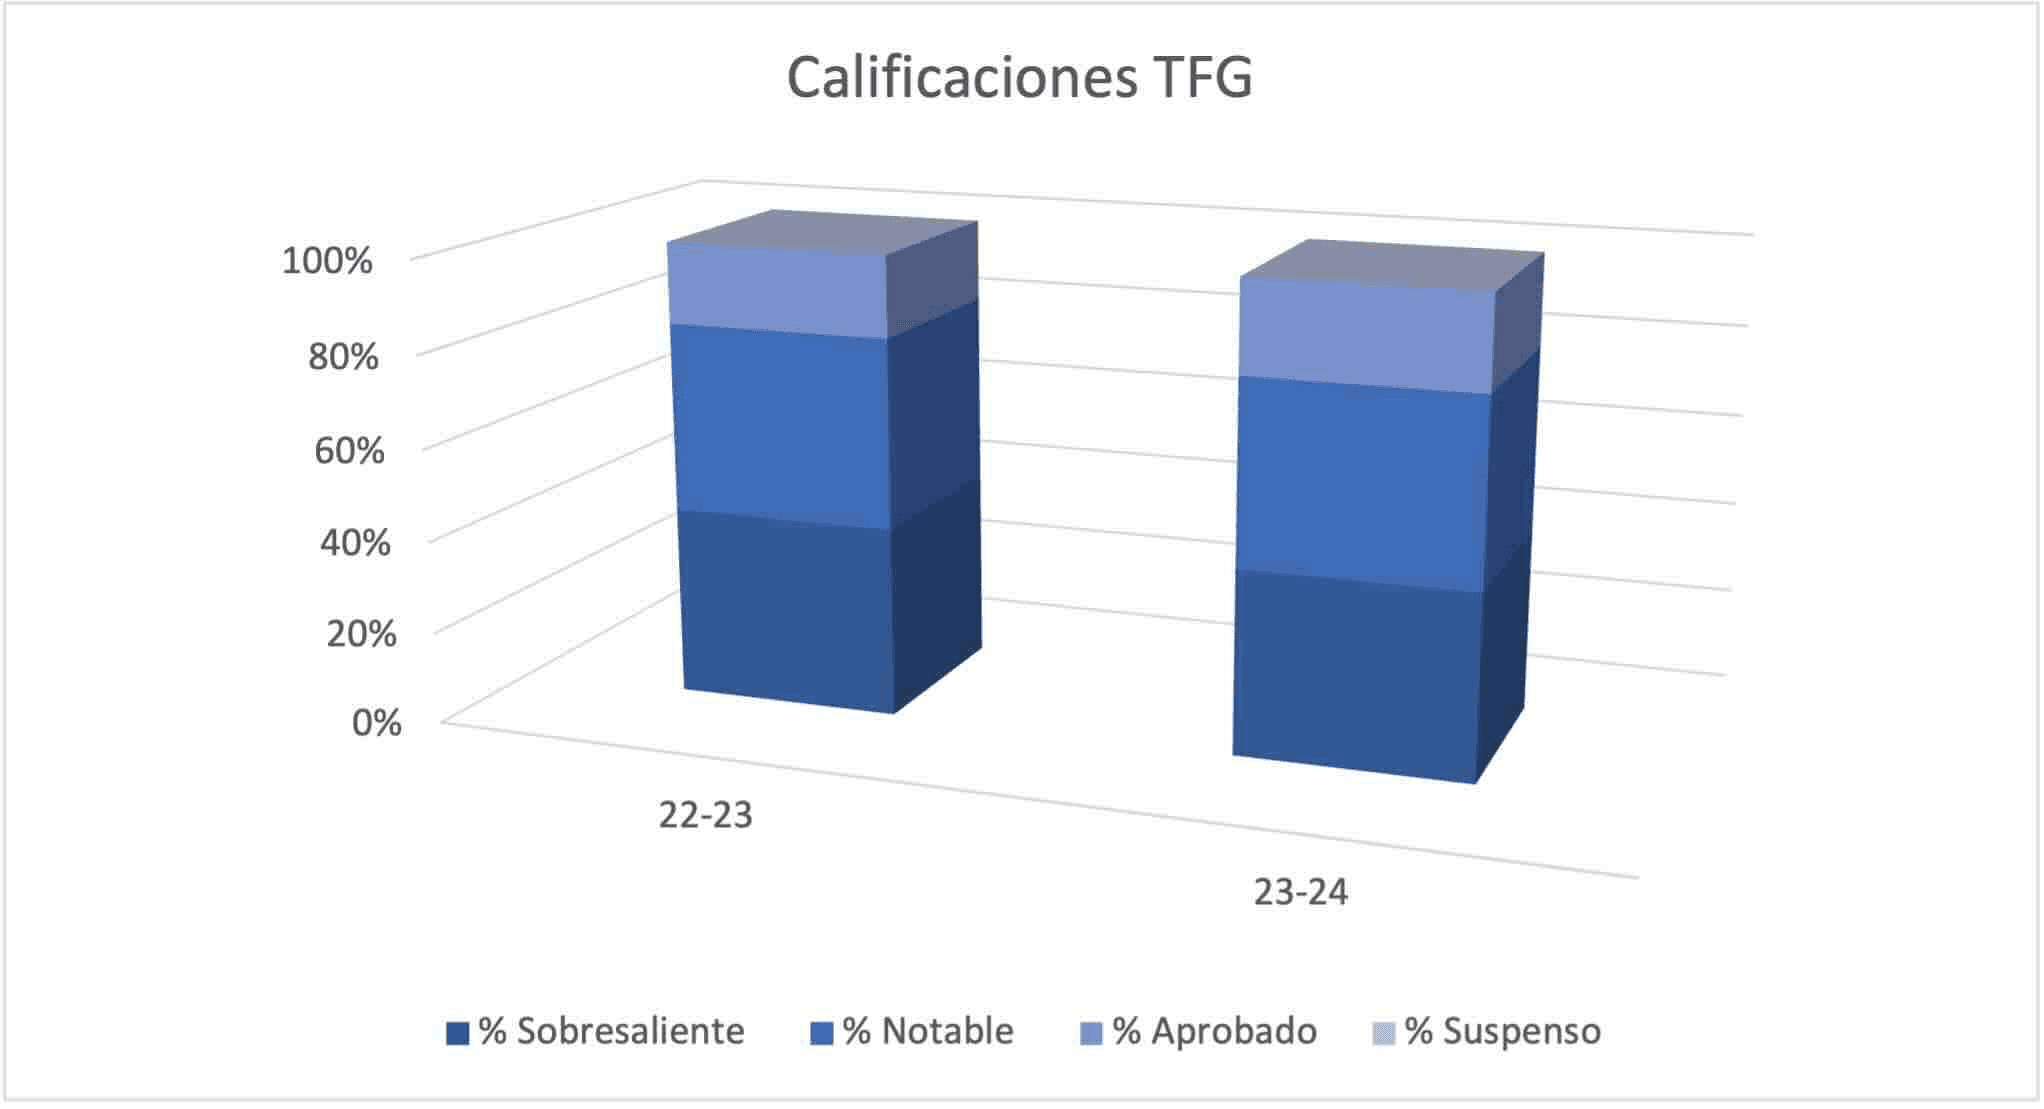
CALIFICACIONES TFG
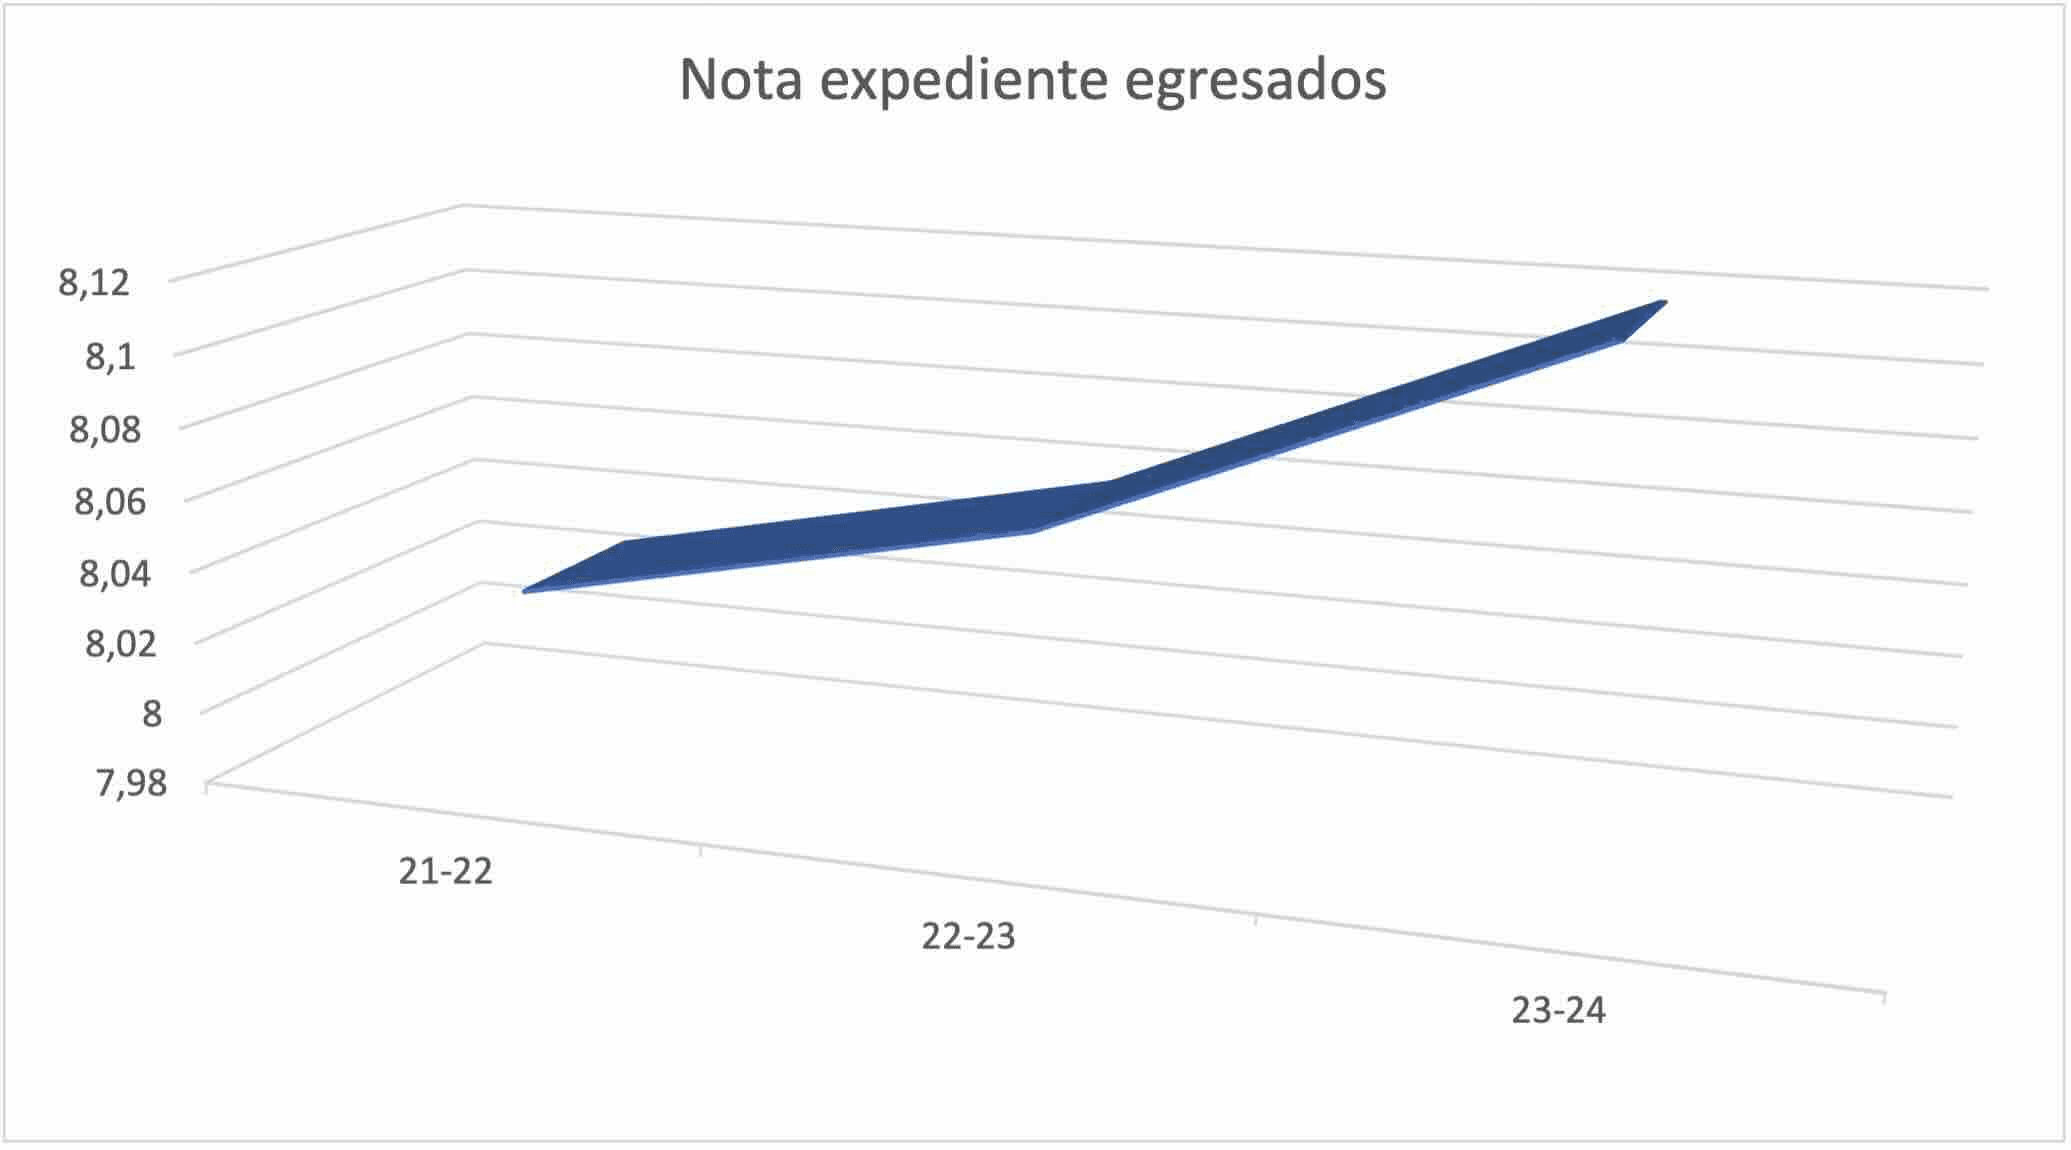
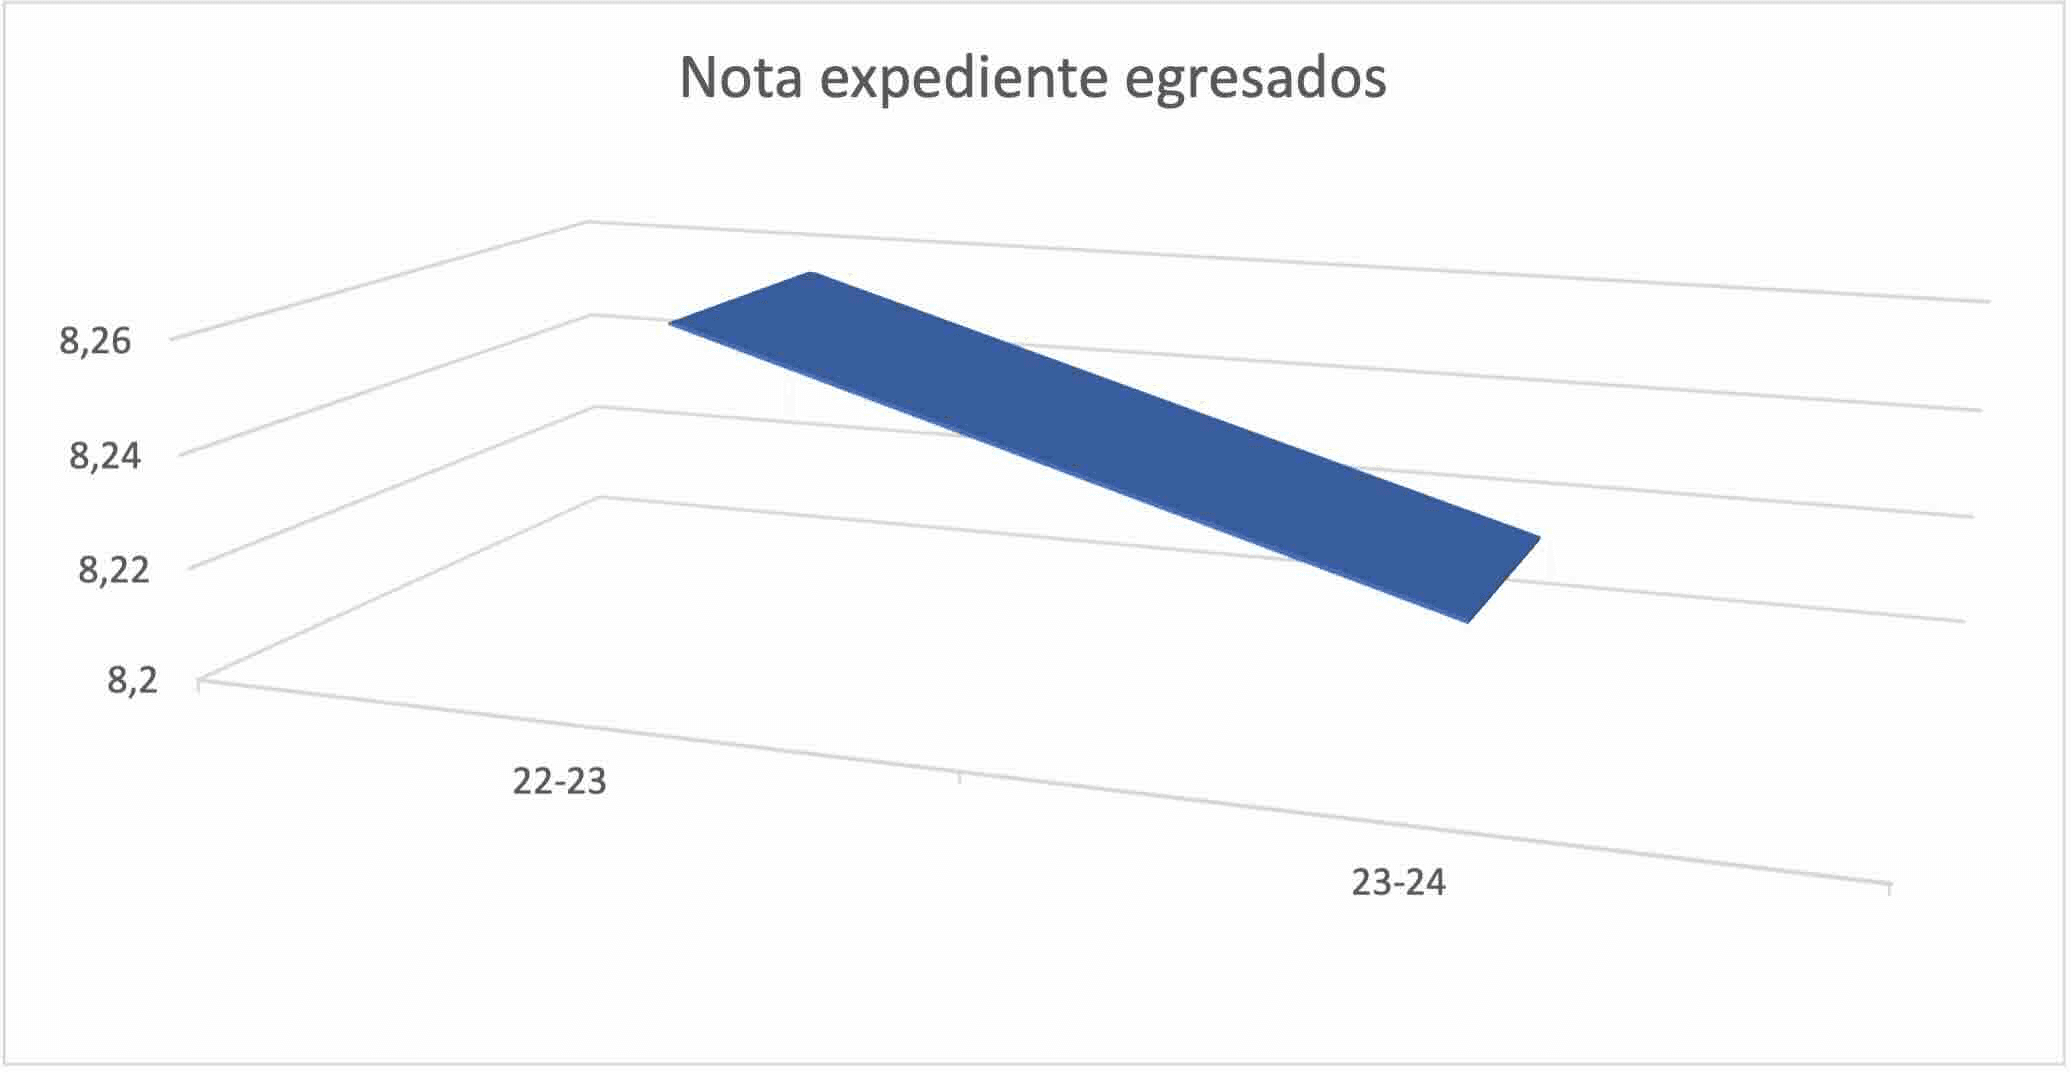
NOTA EXPEDIENTE EGRESADOS
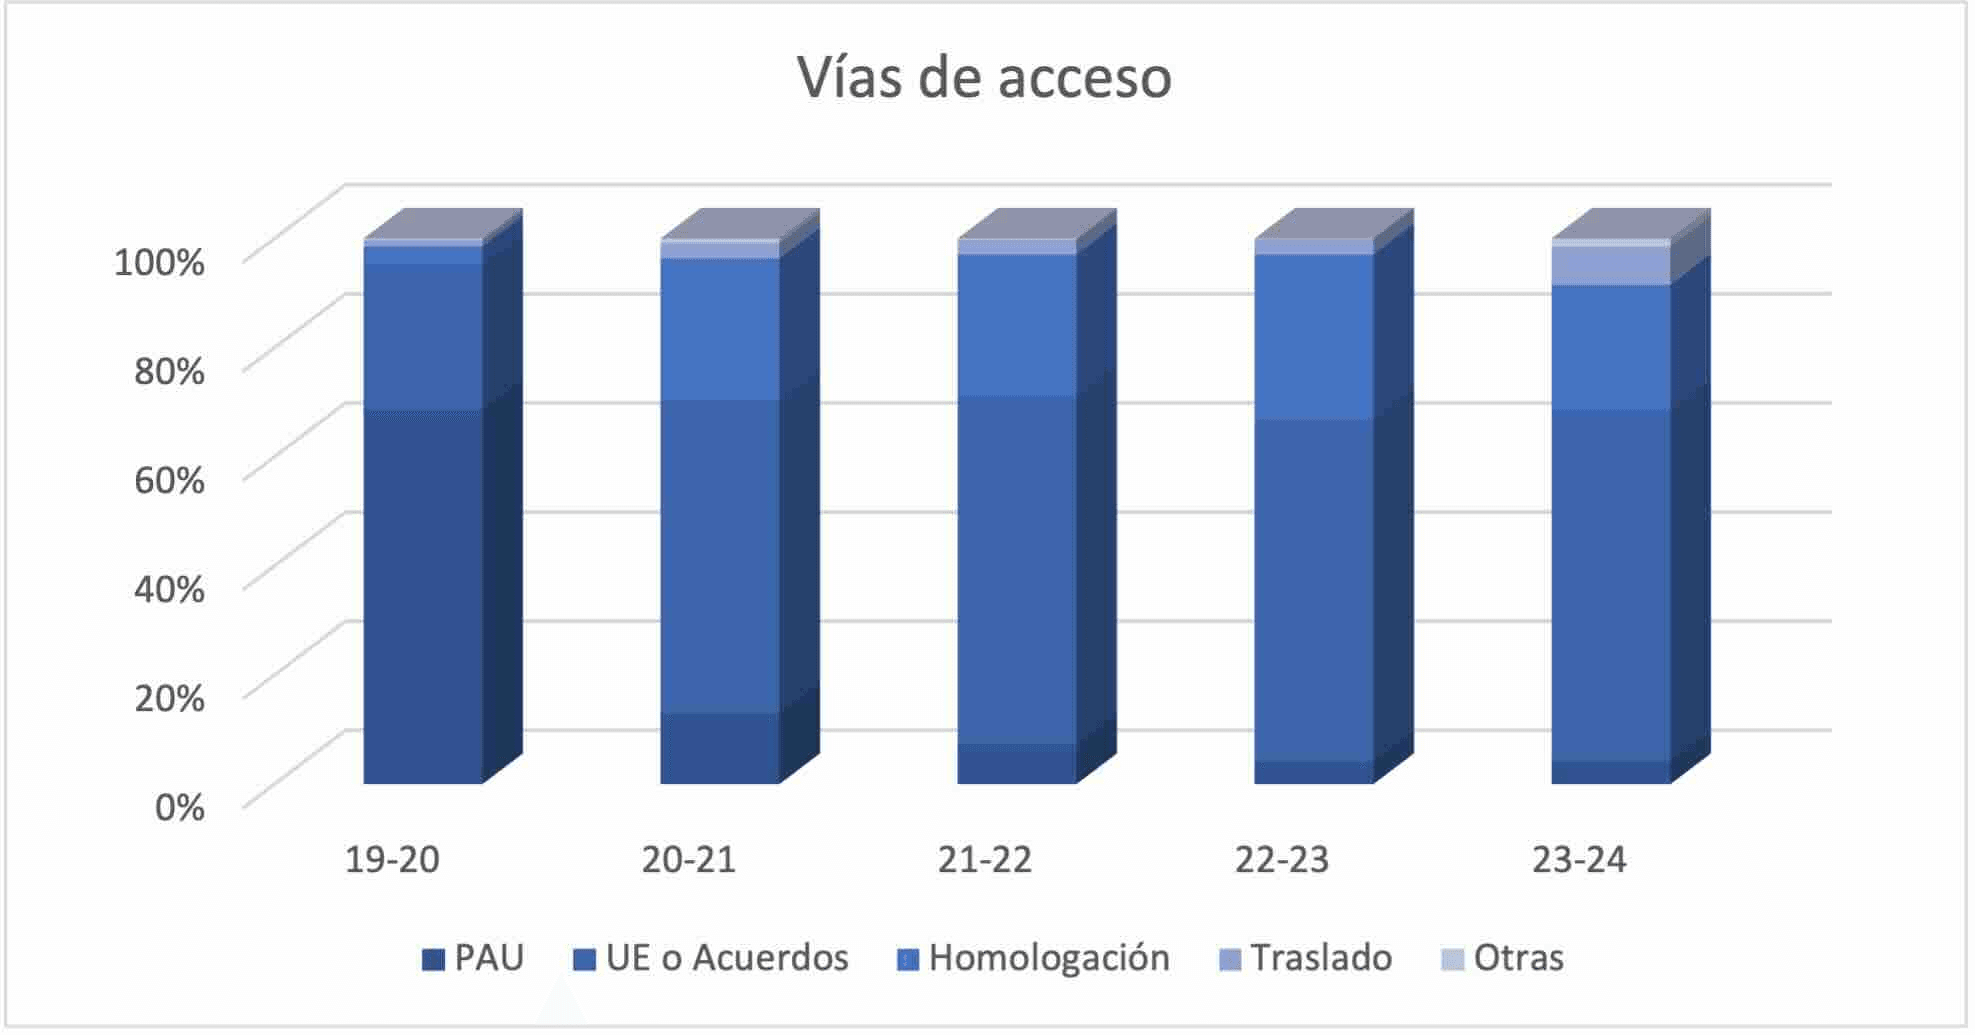
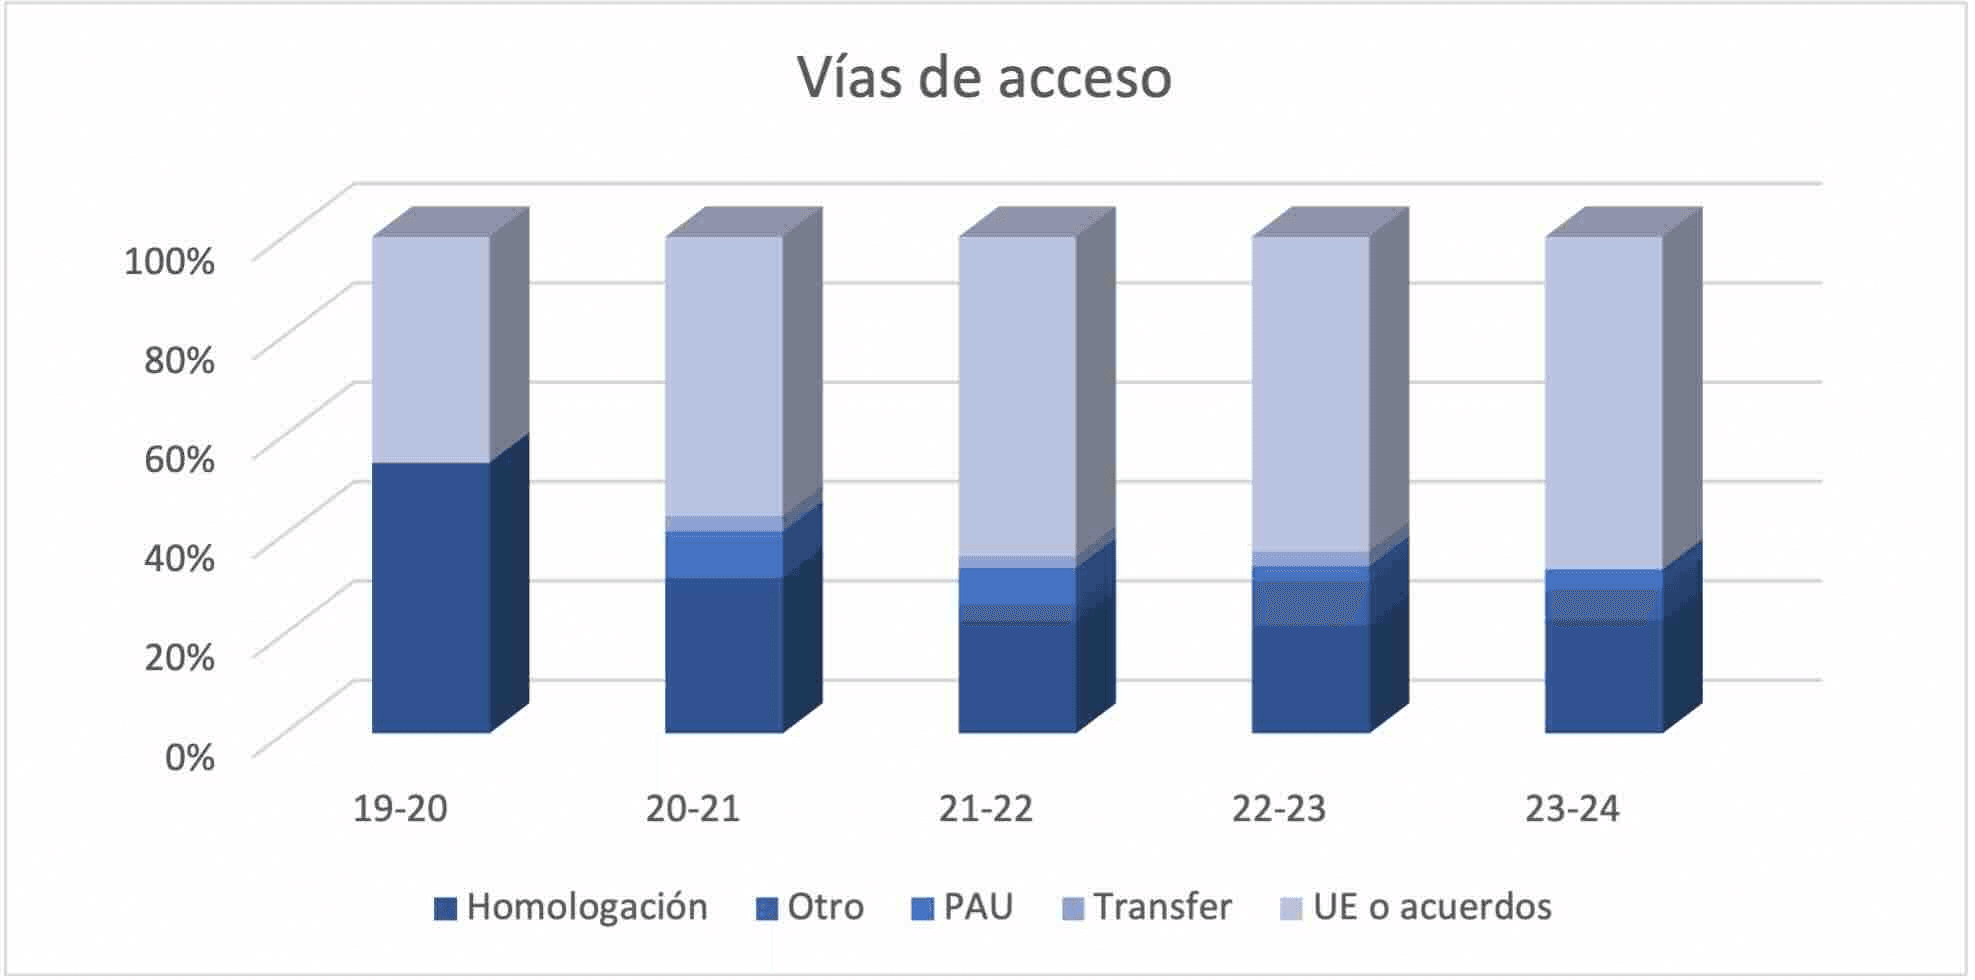
VÍAS DE ACCESO
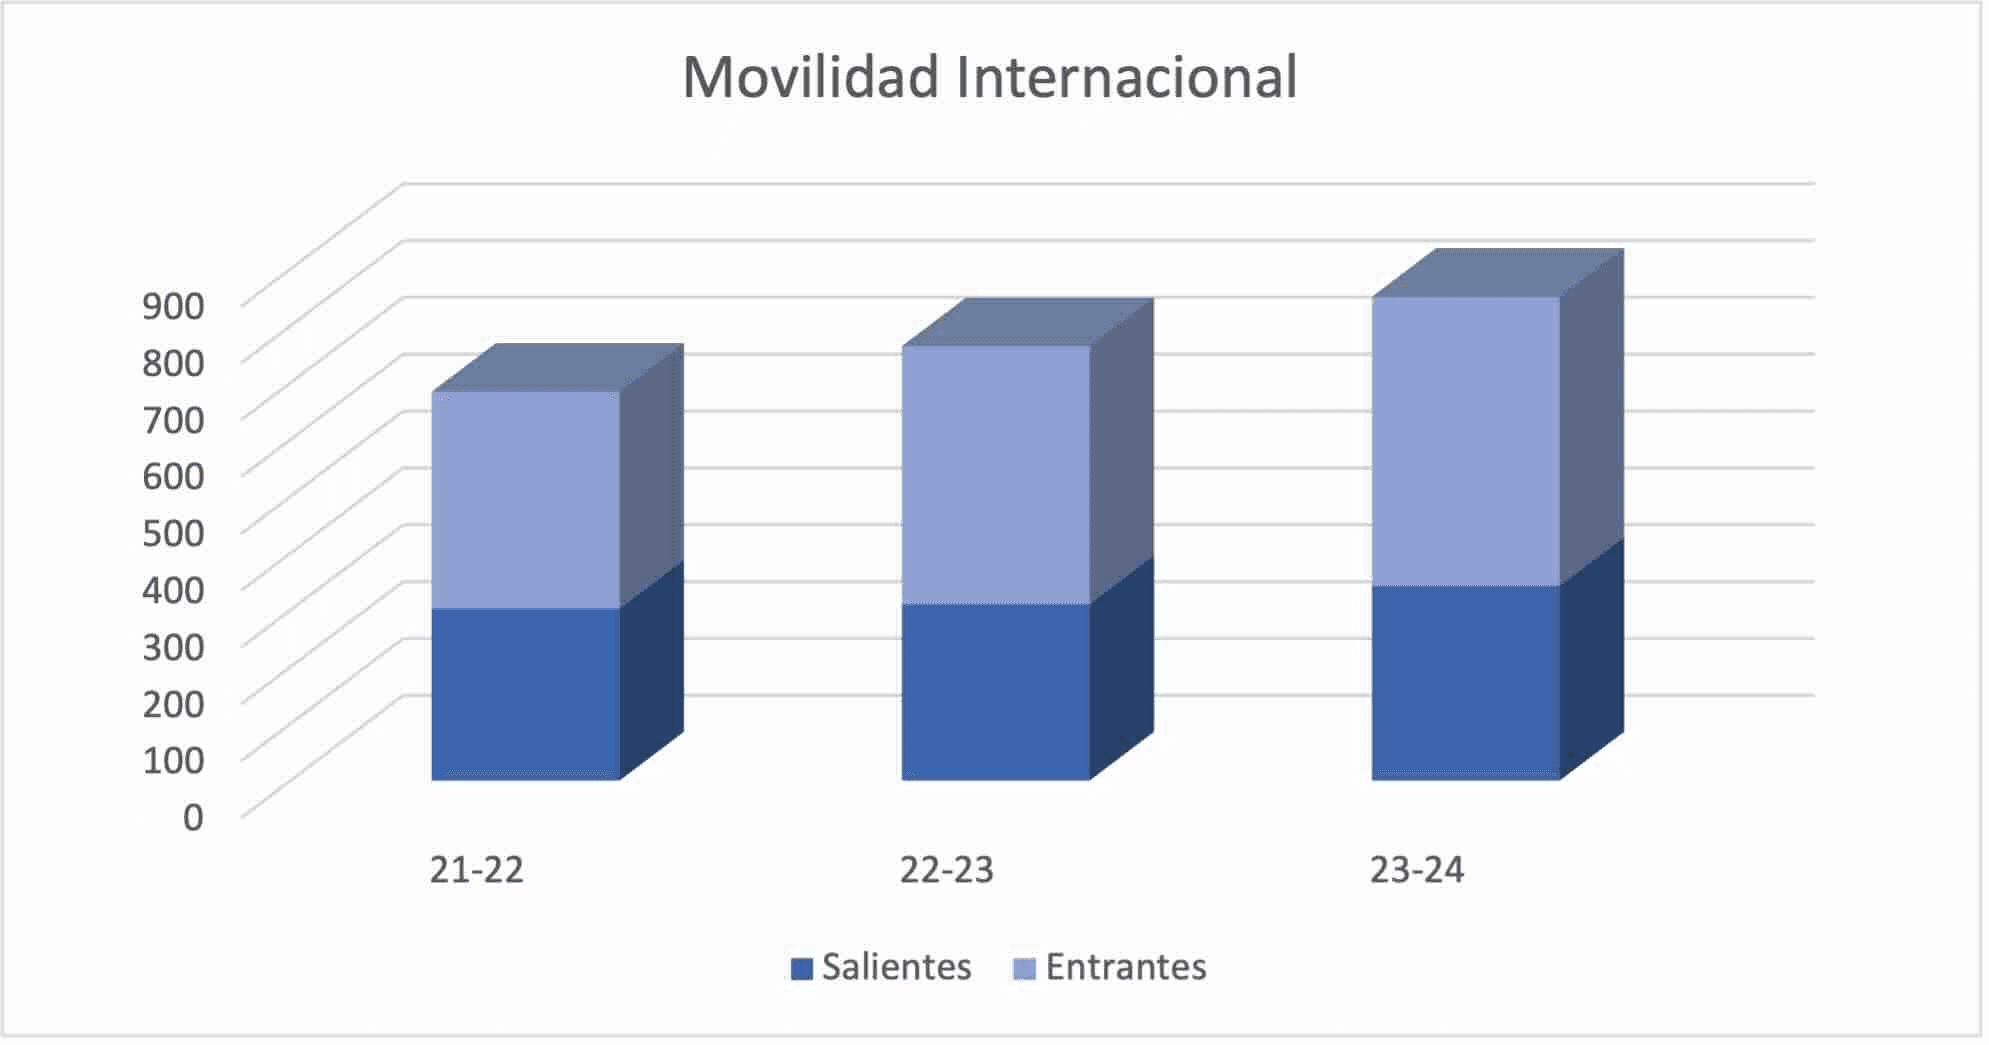
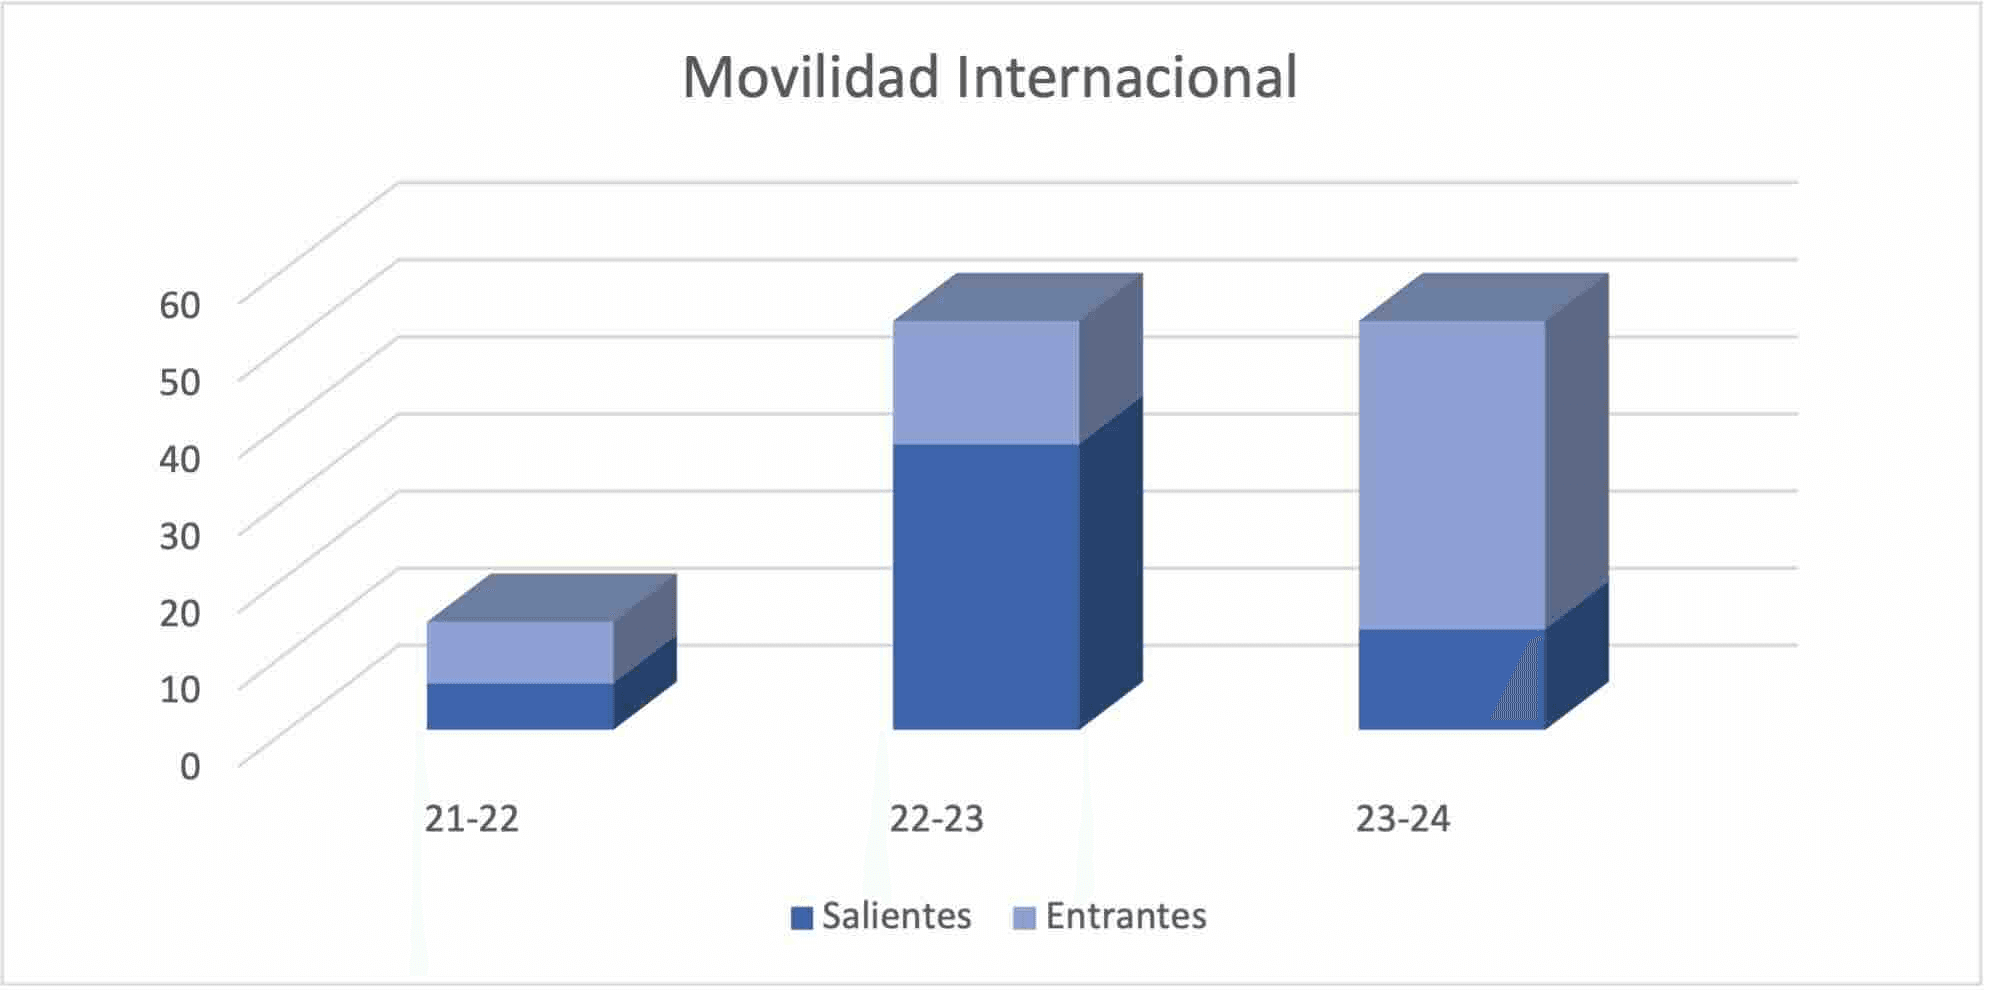
MOVILIDAD INTERNACIONAL
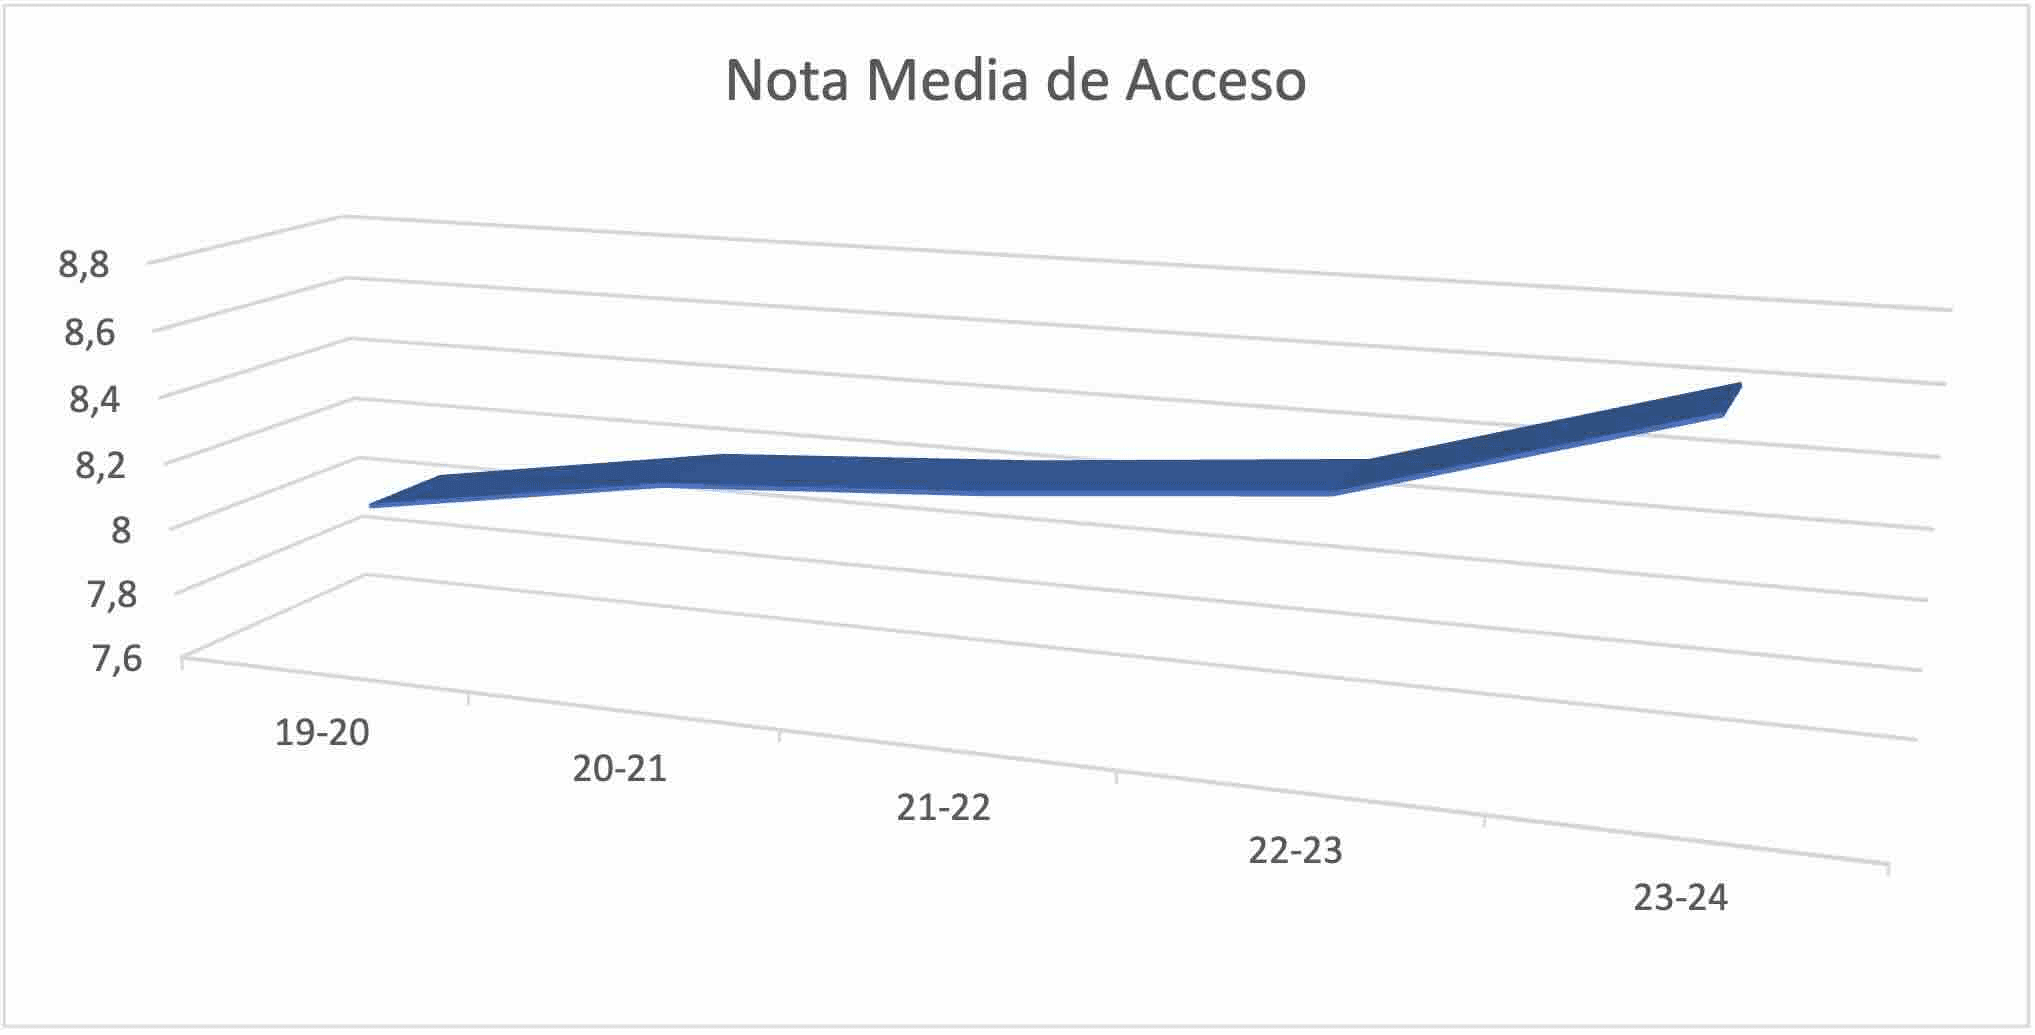
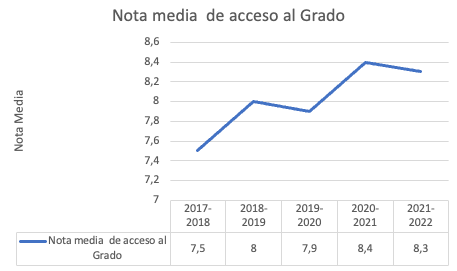
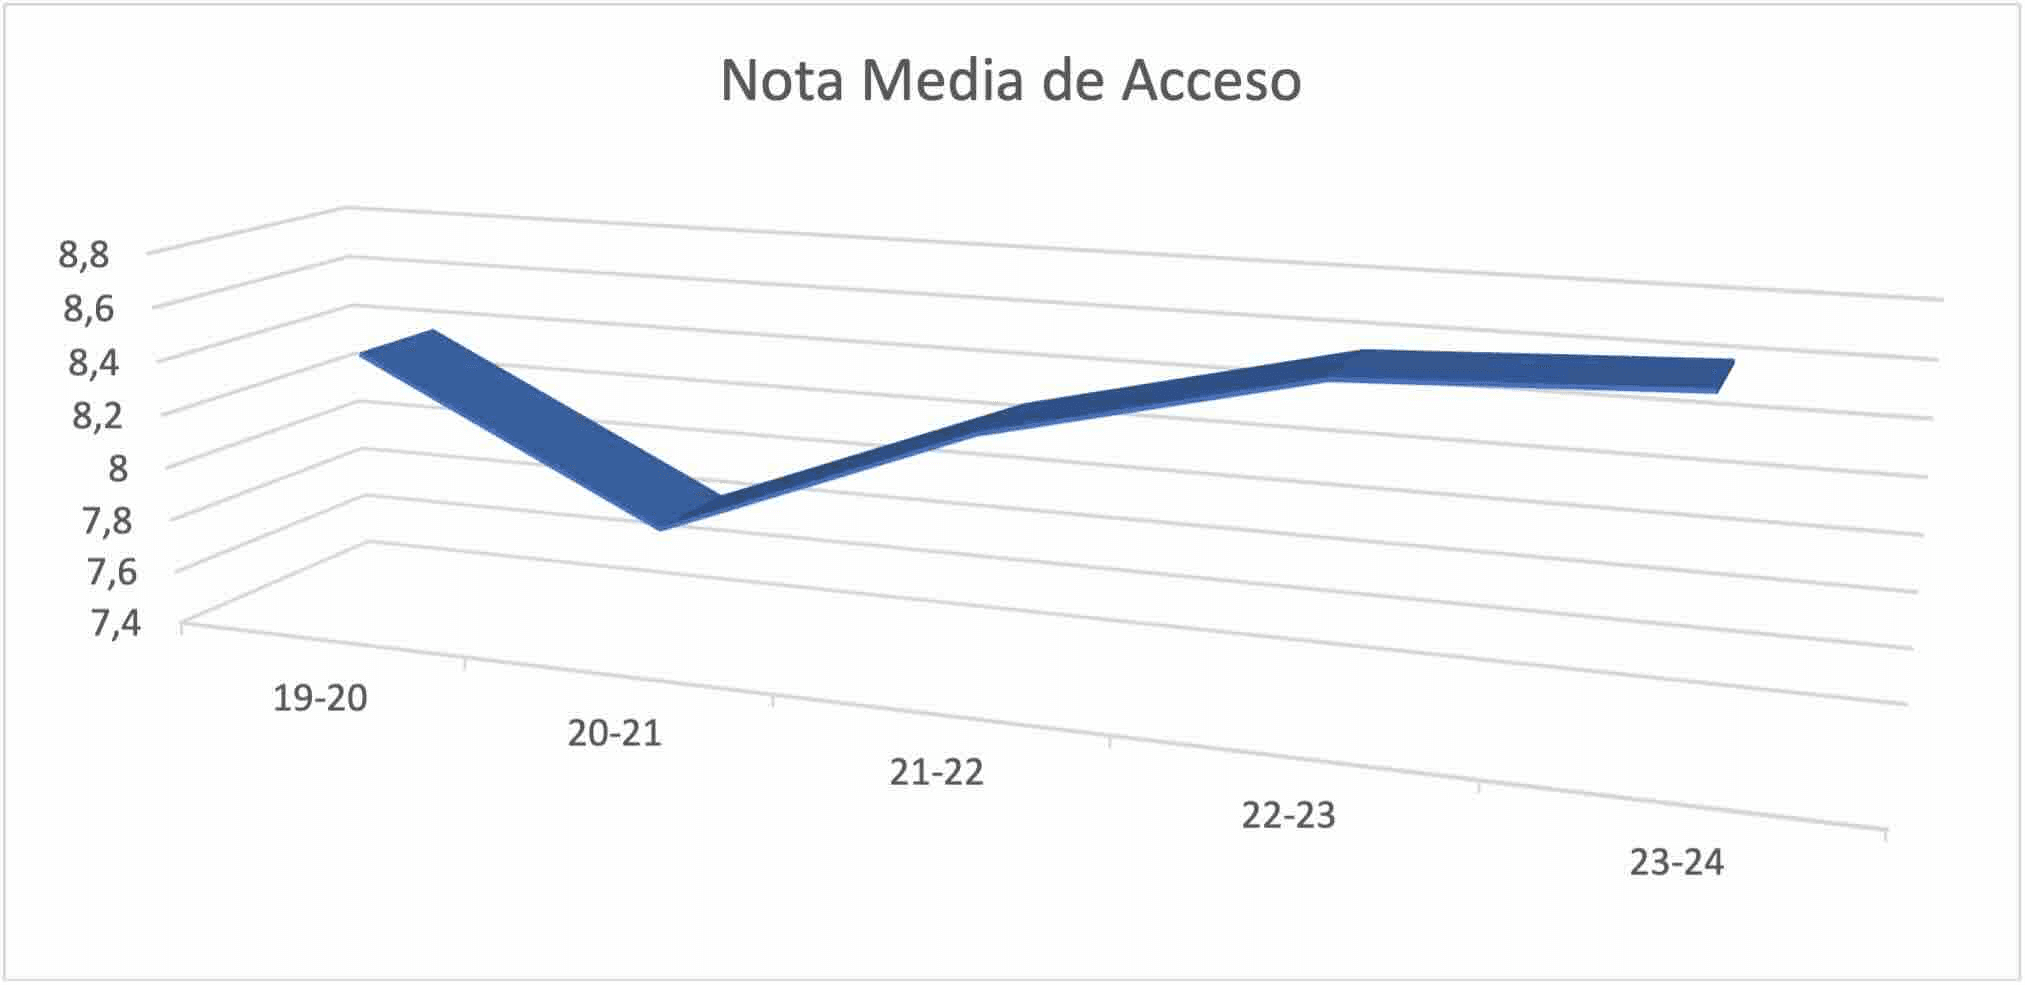
NOTA MEDIA DE ACCESO
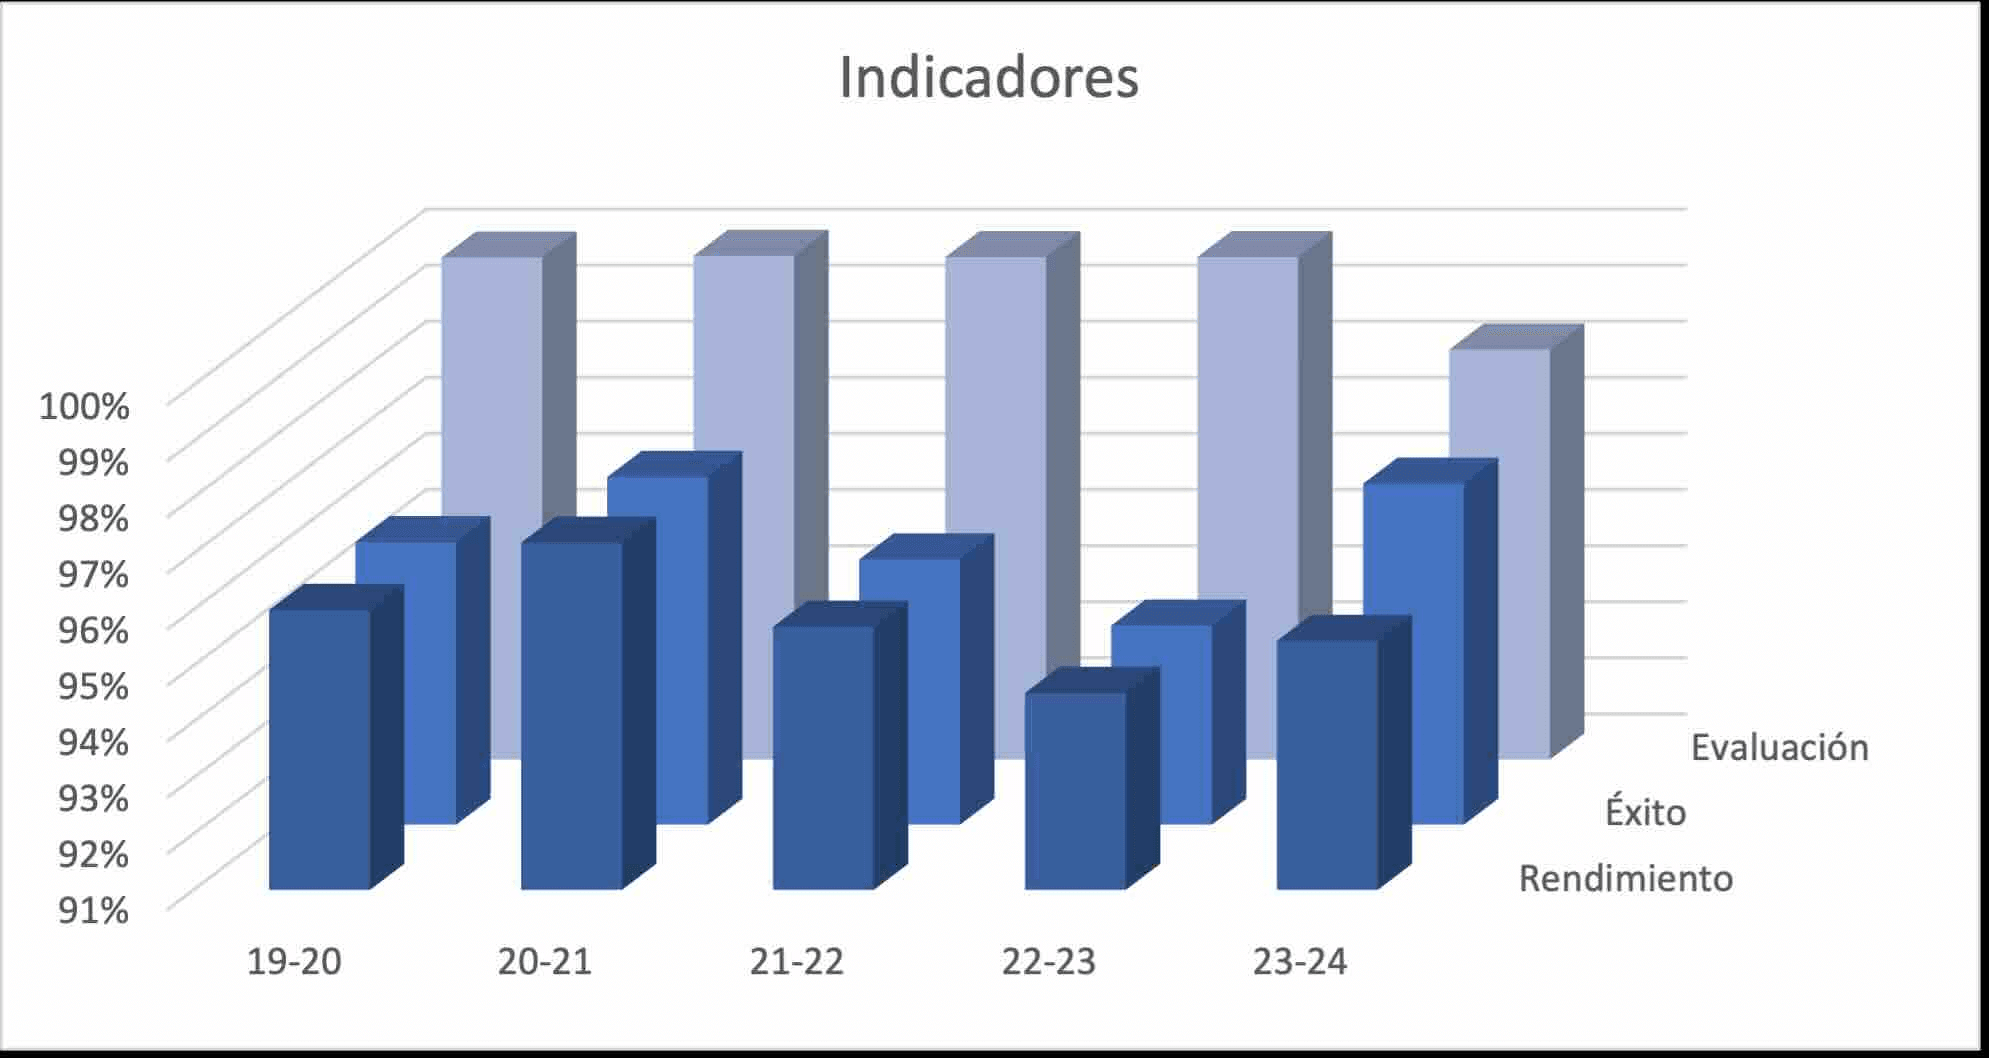
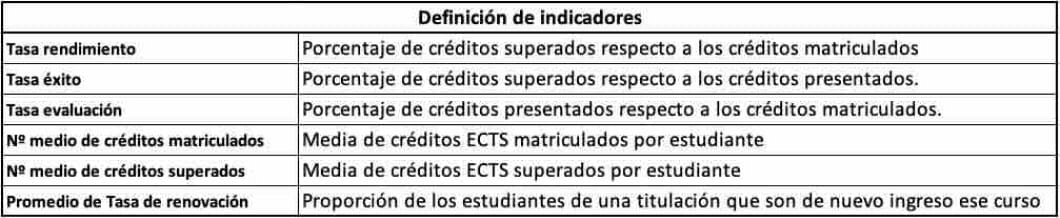
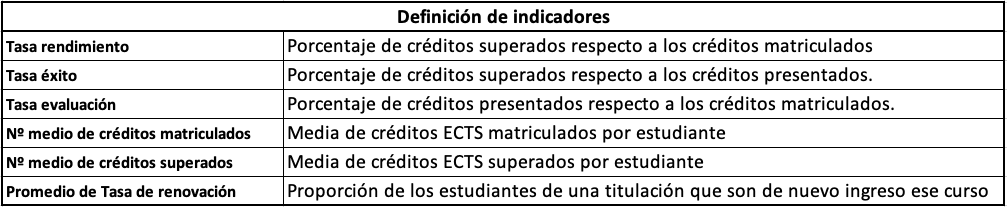
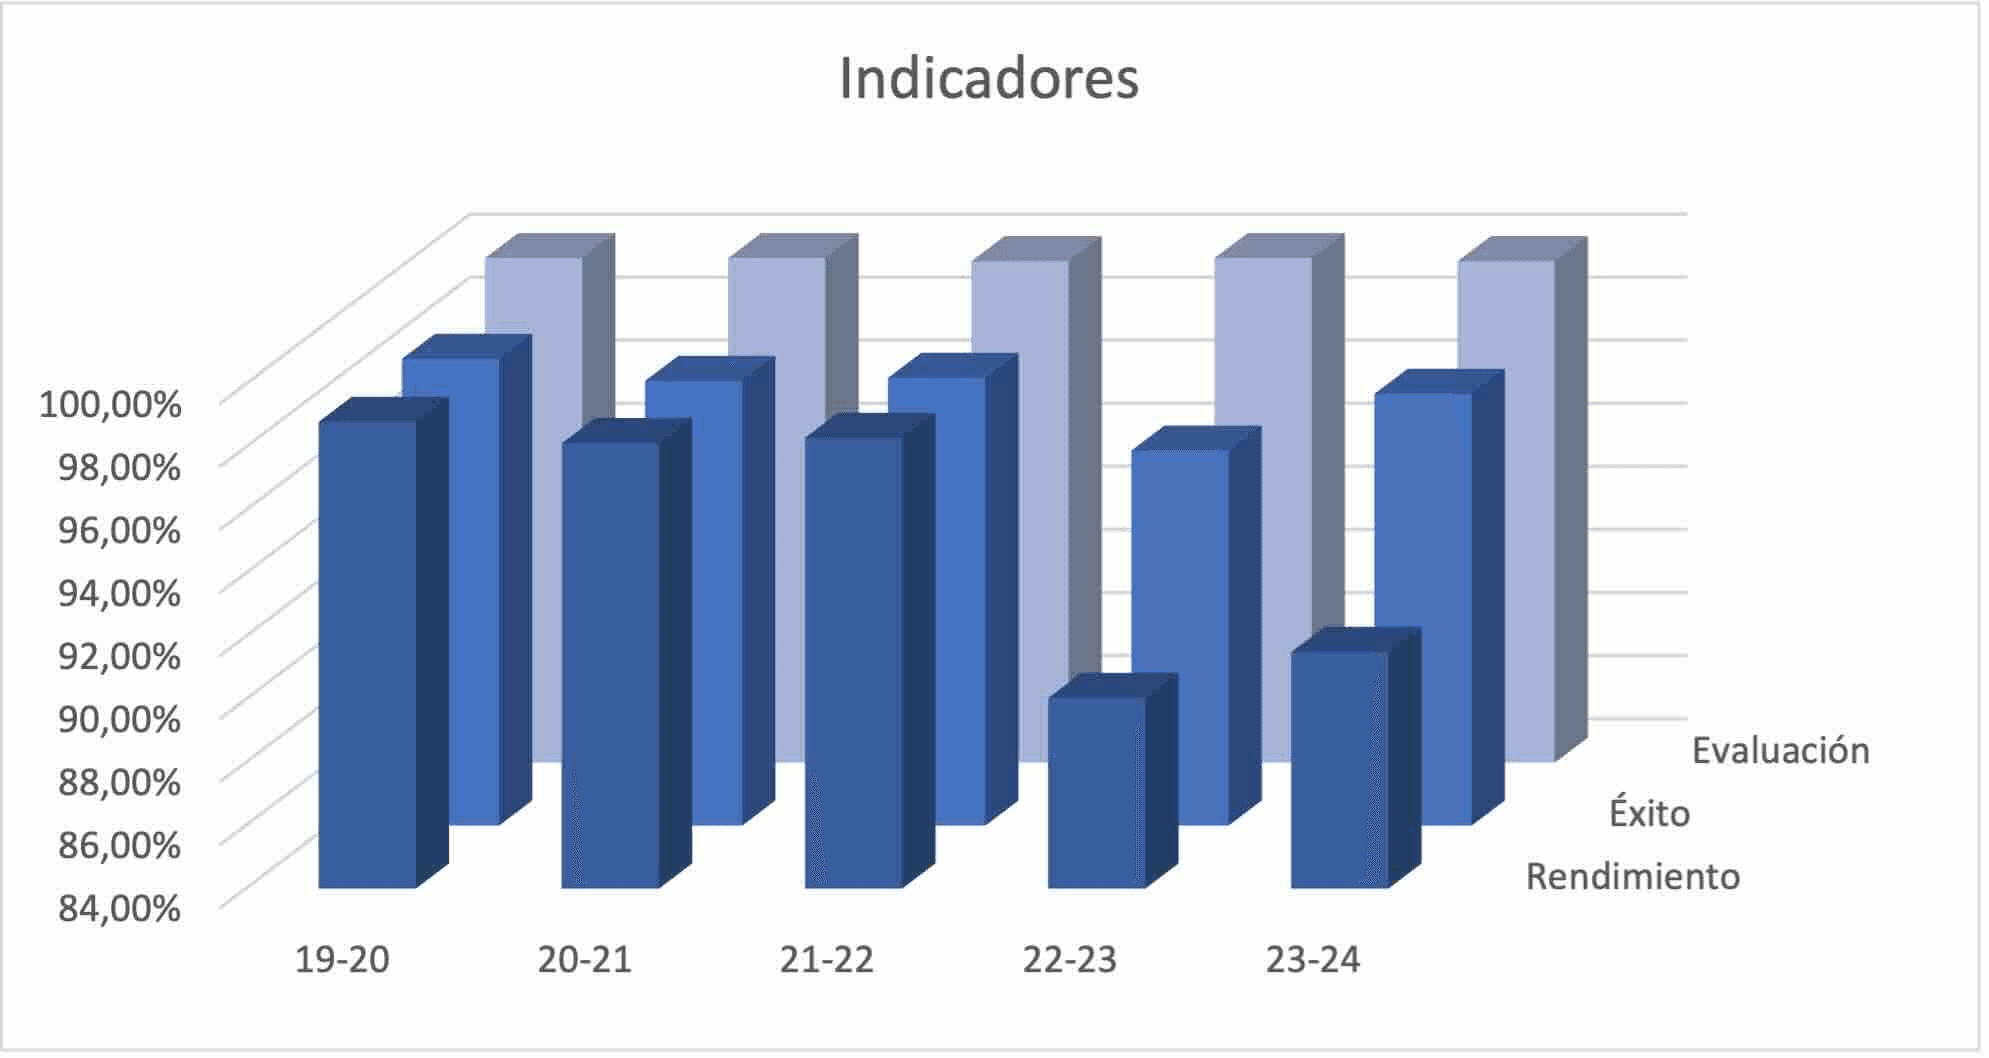
INDICADORES
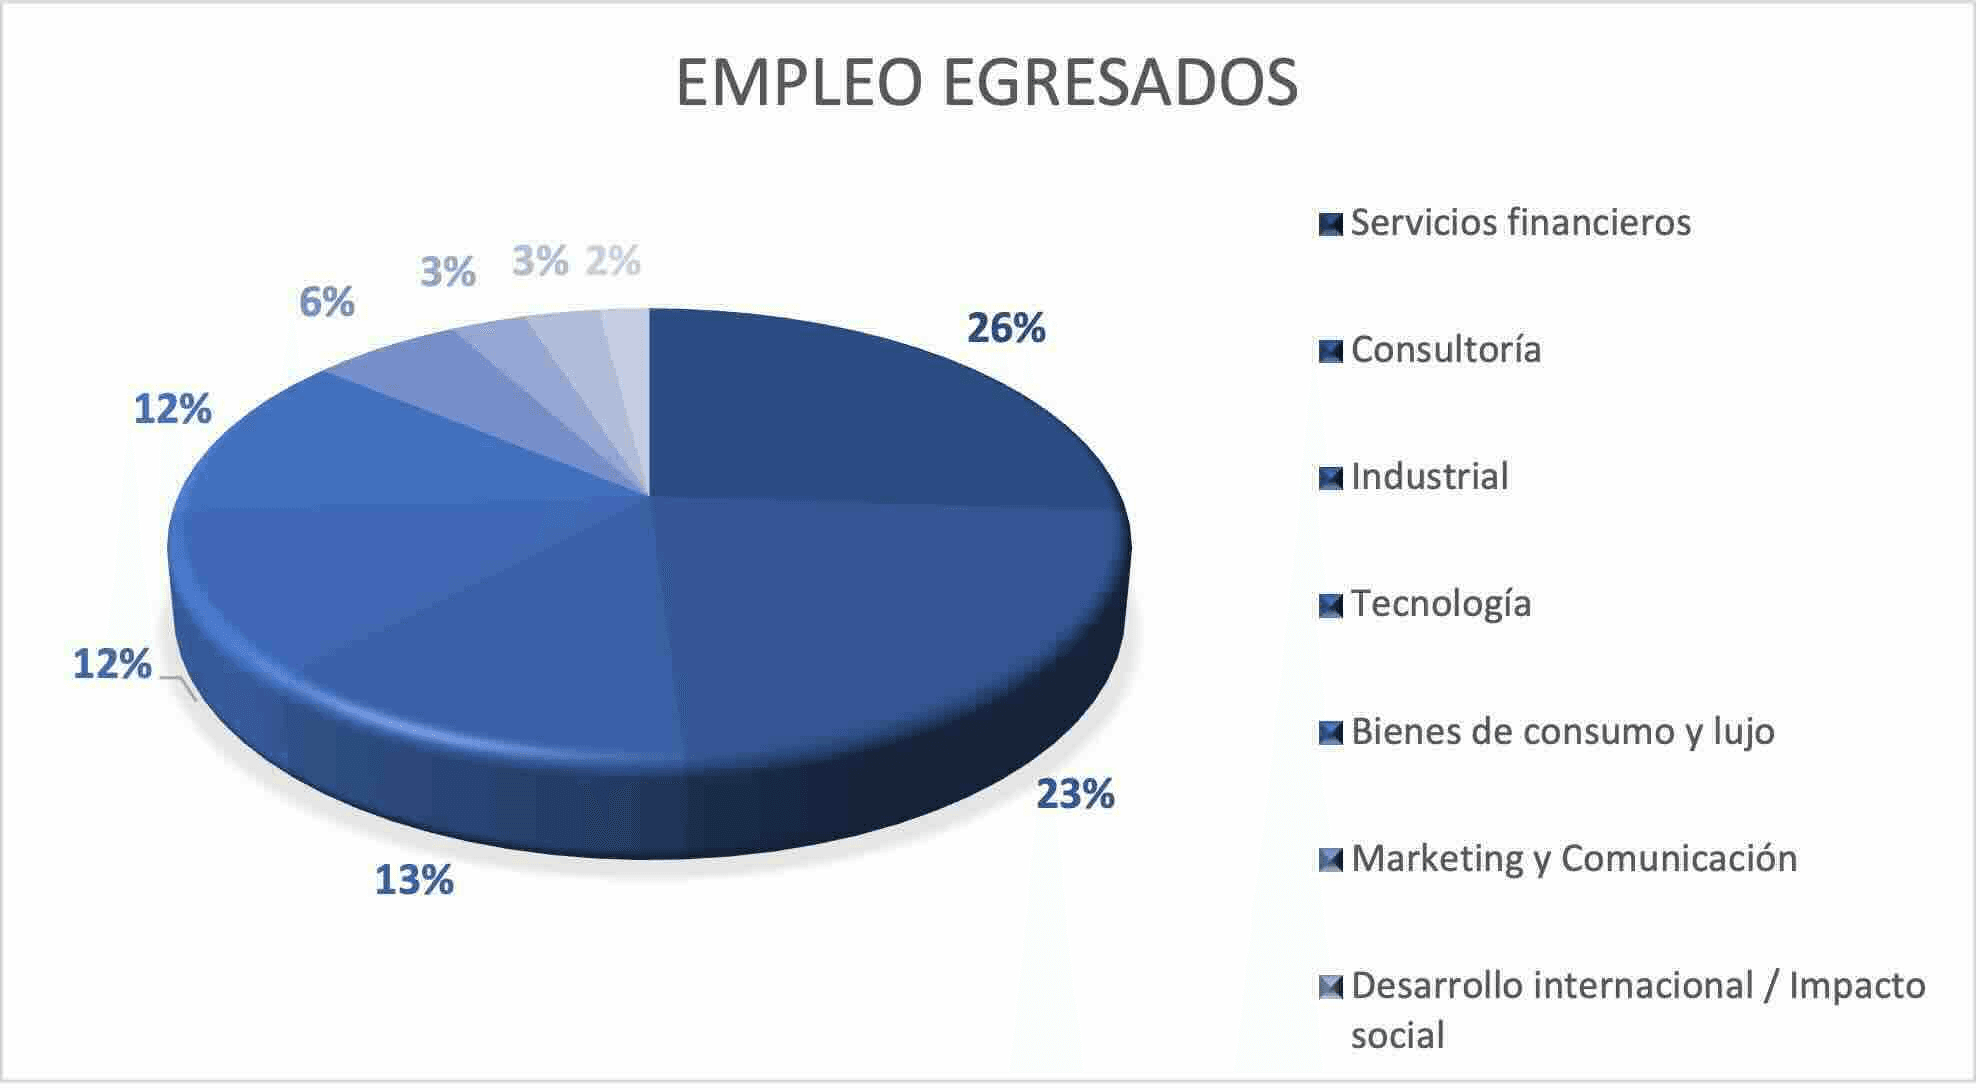
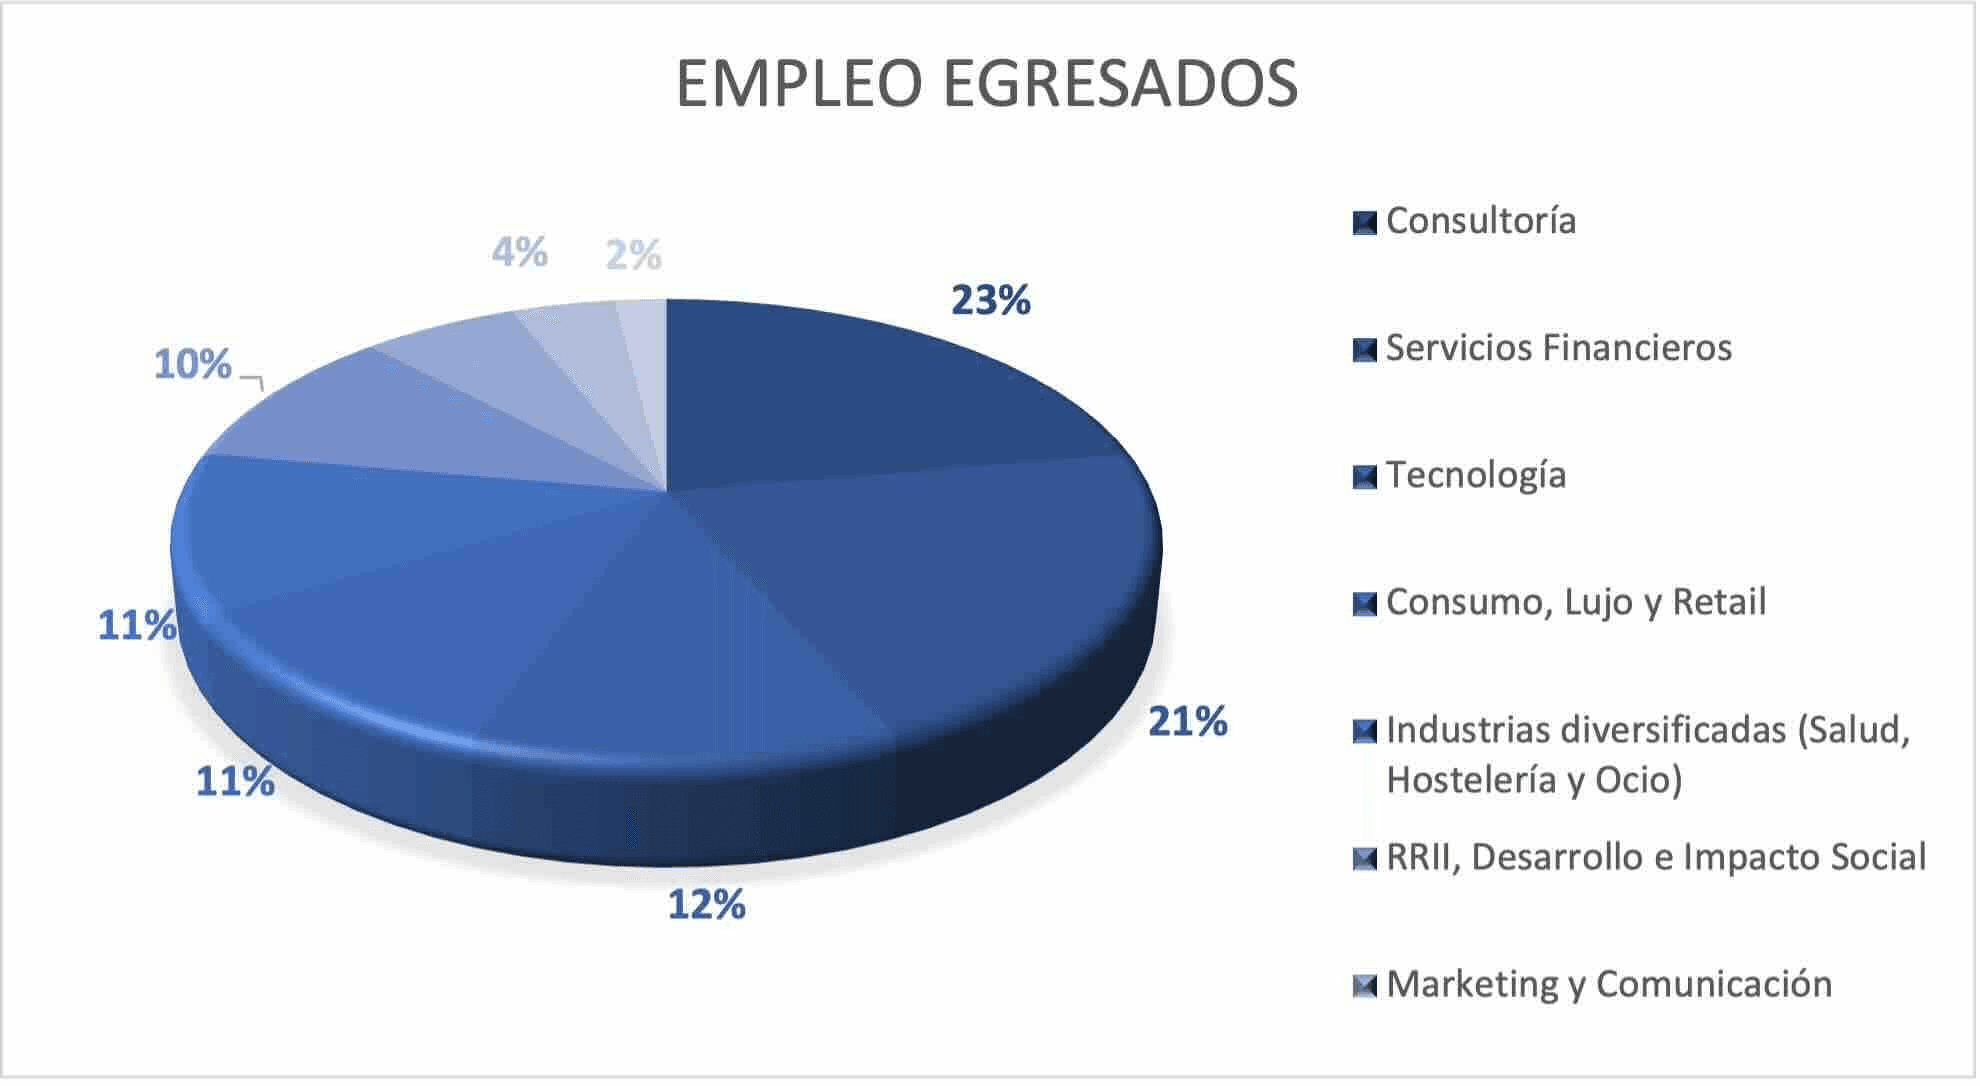
EMPLEO EGRESADOS
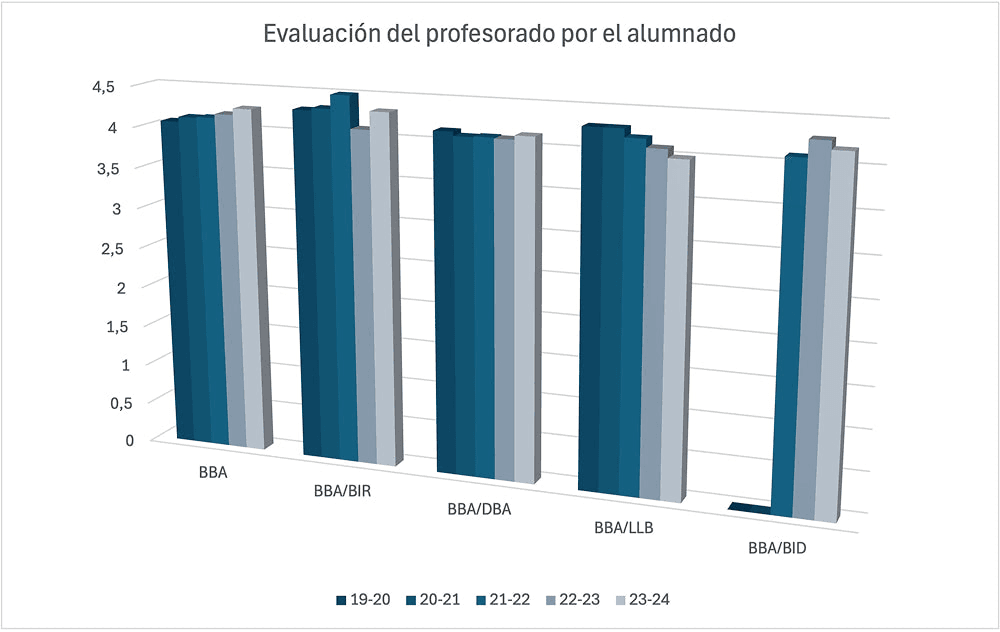
EVALUACIÓN DEL PROFESORADO POR EL ALUMNO
GRADO EN COMPORTAMIENTO Y CIENCIAS SOCIALES
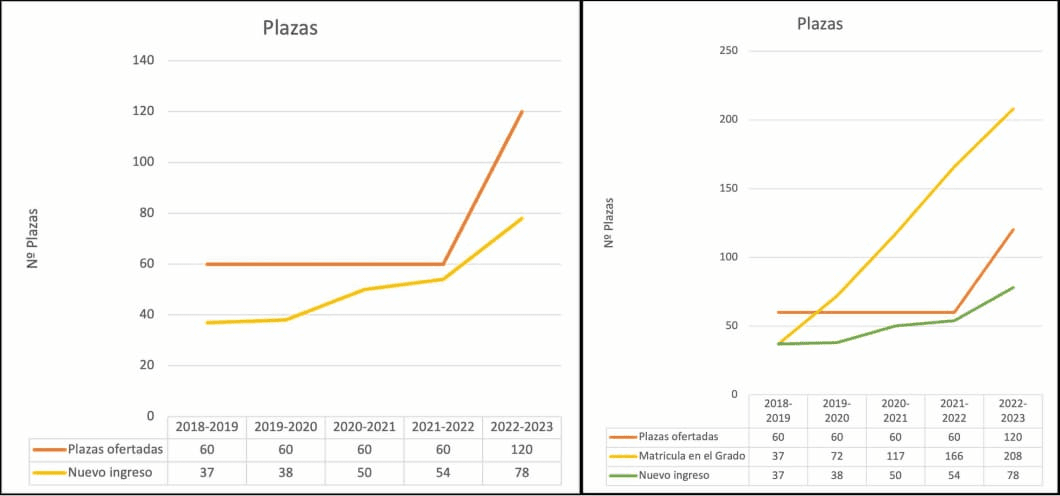
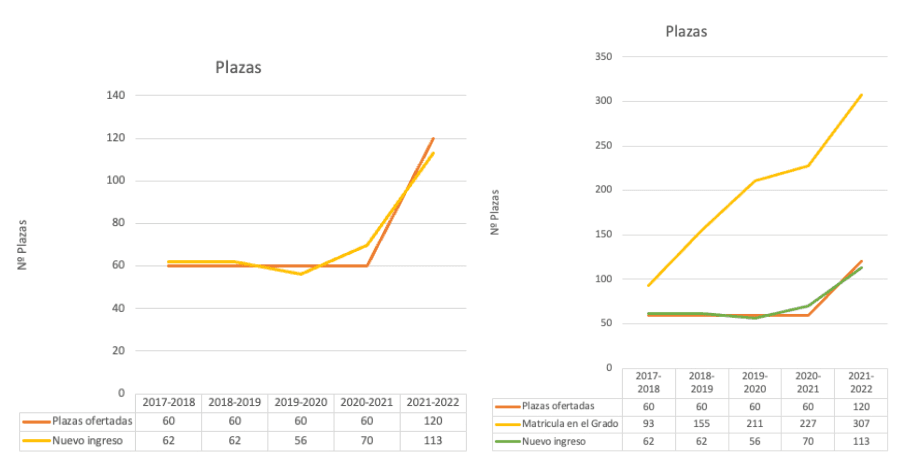
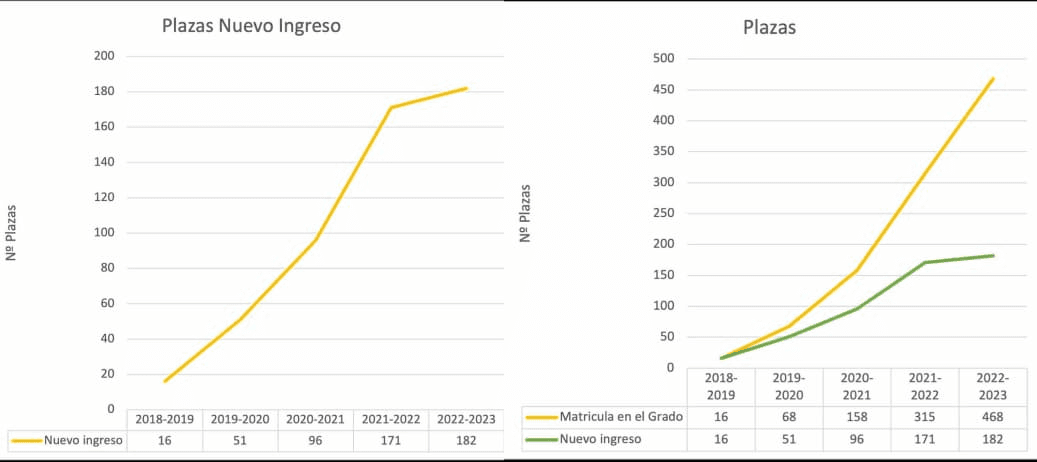
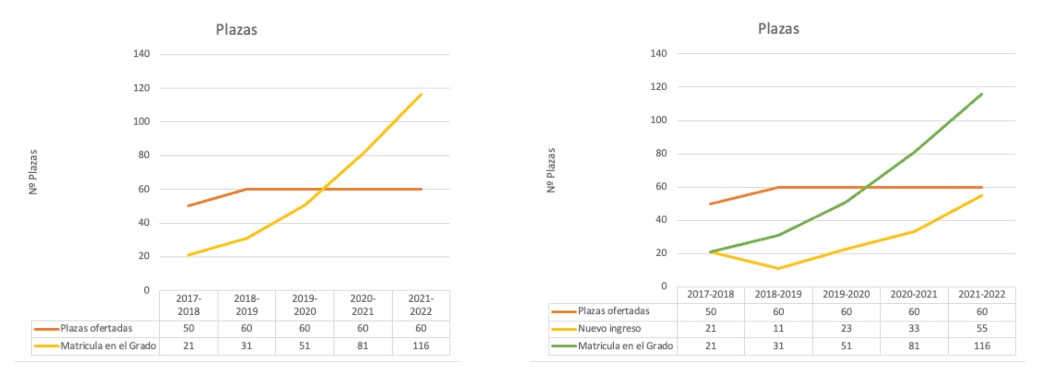
PLAZAS
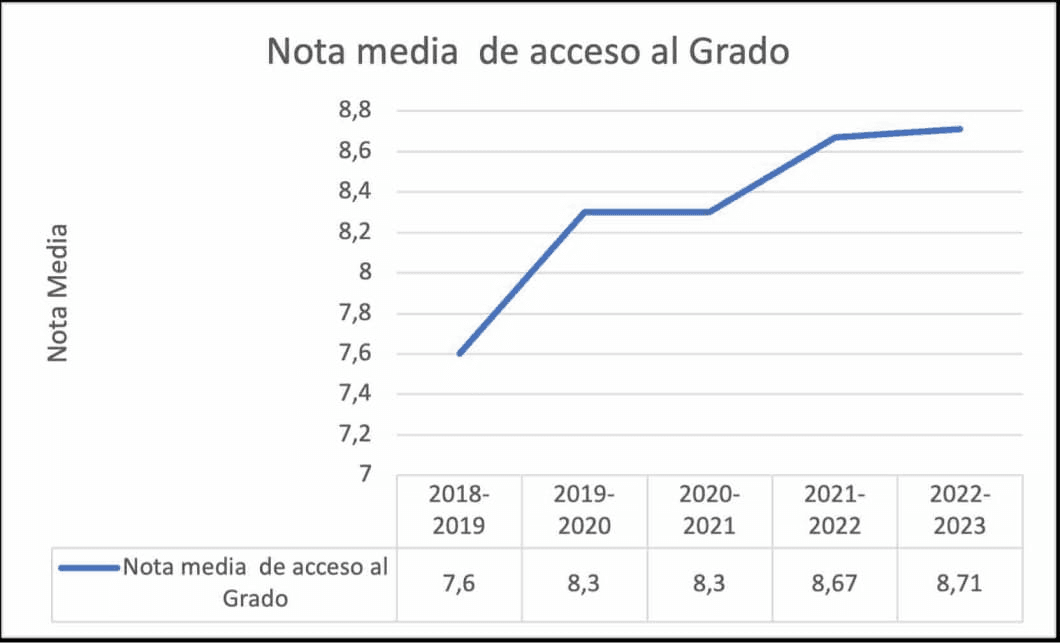
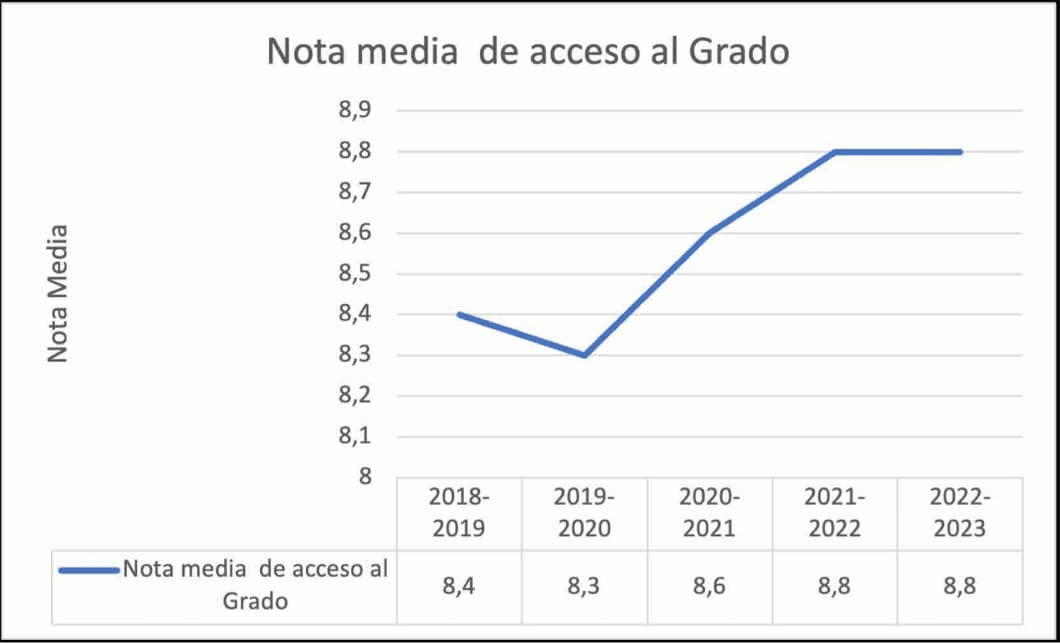
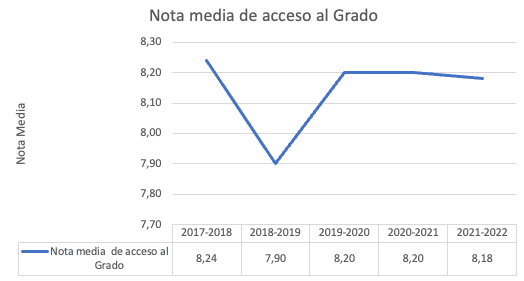
NOTA MEDIA
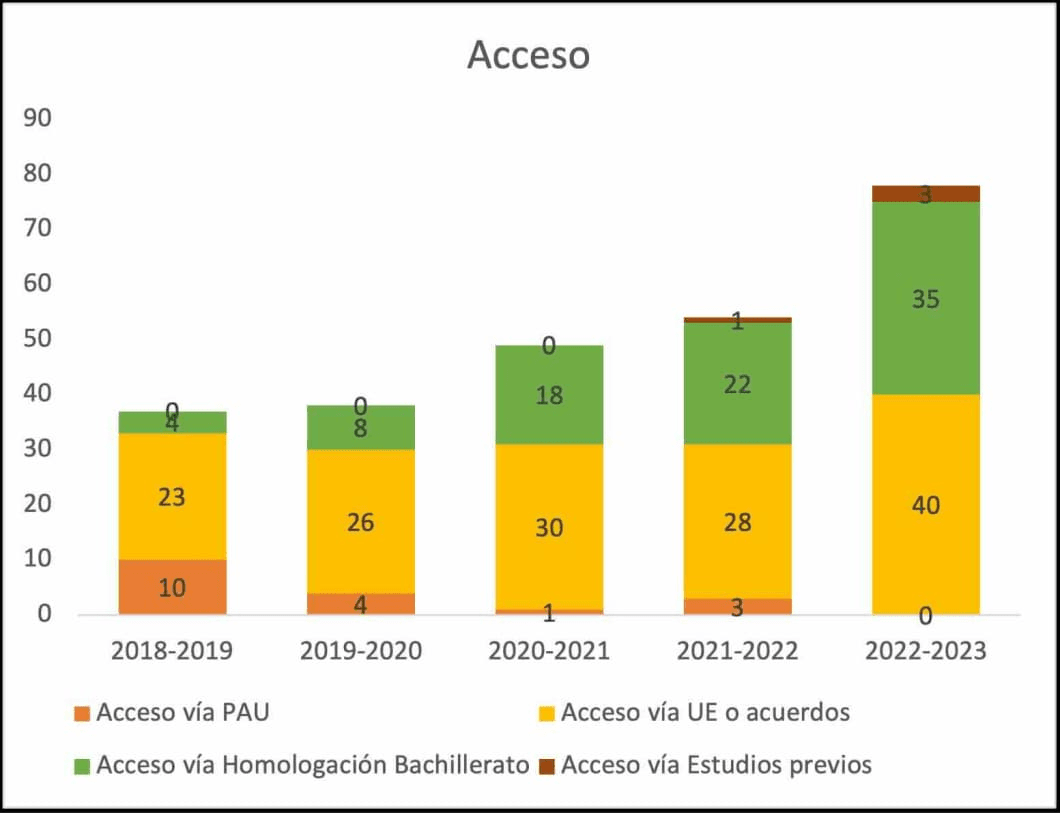
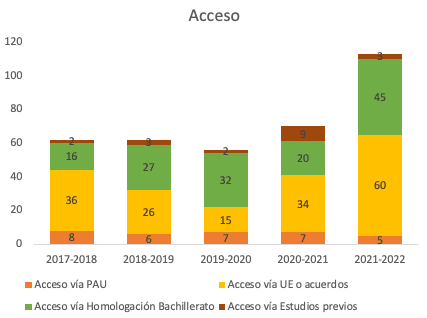
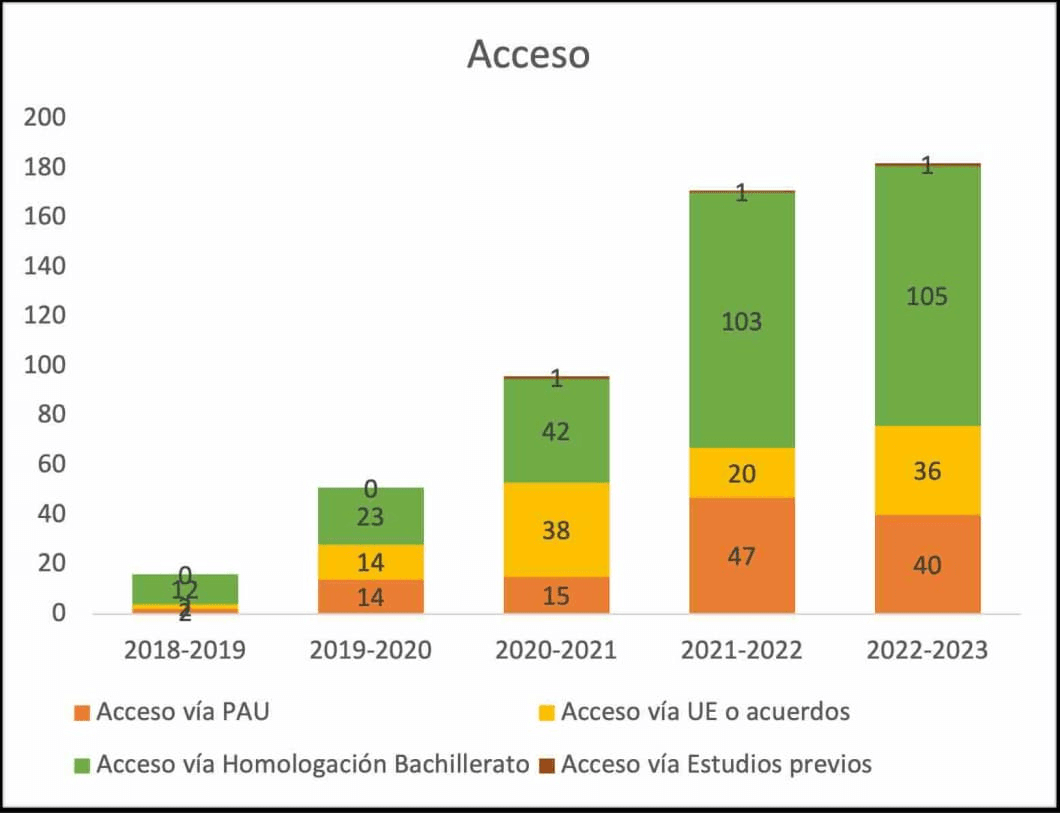
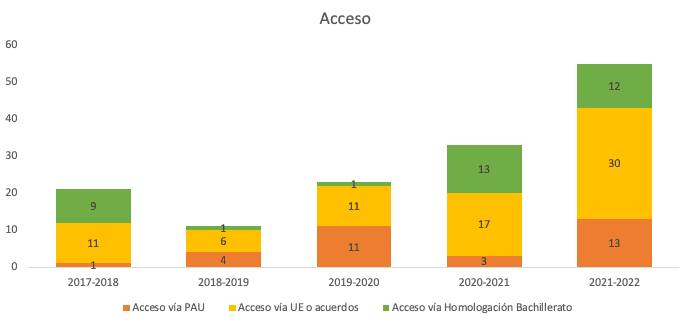
ACCESO
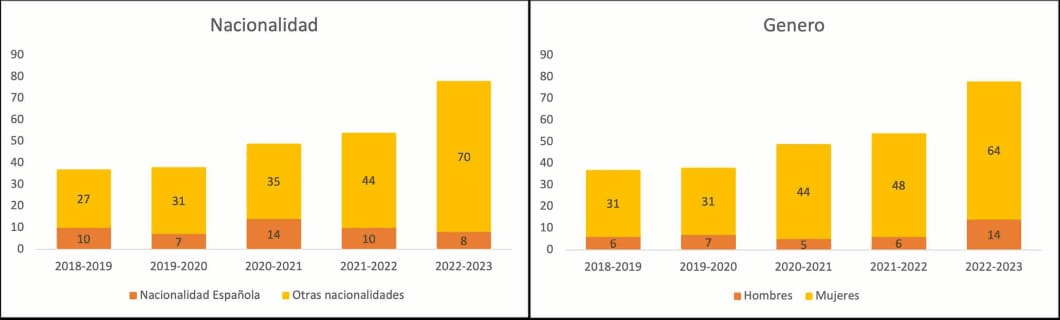
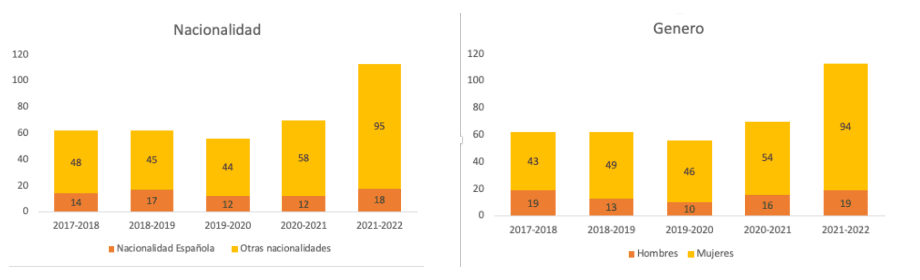
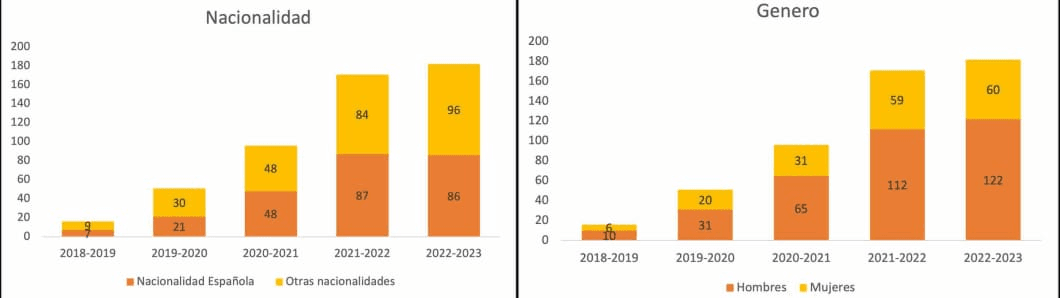
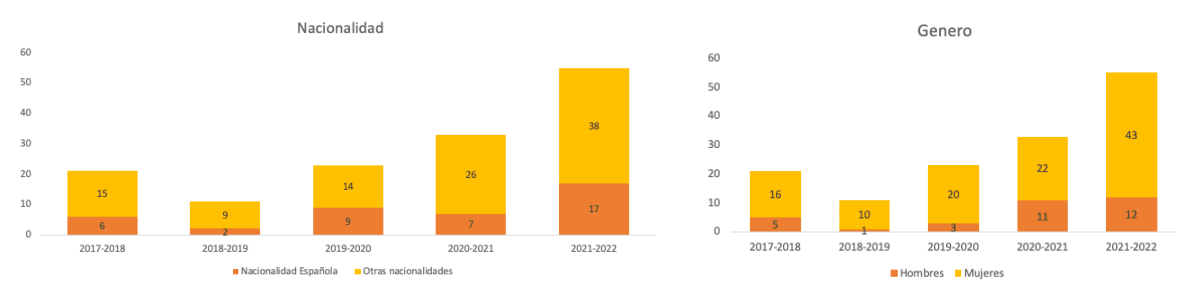
NACIONALIDAD Y GÉNERO
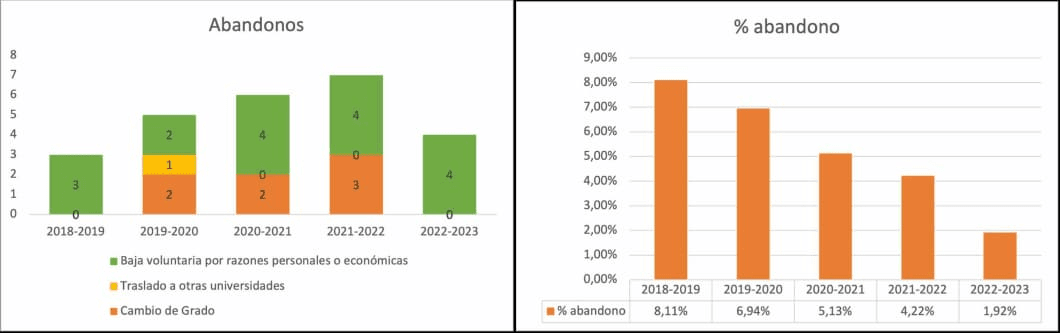
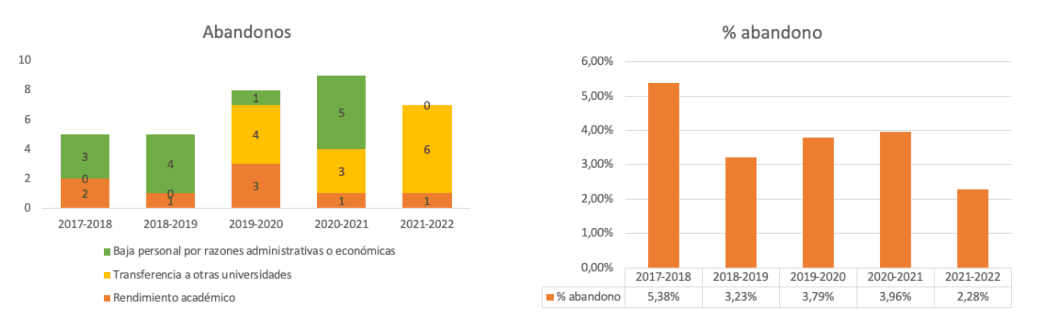
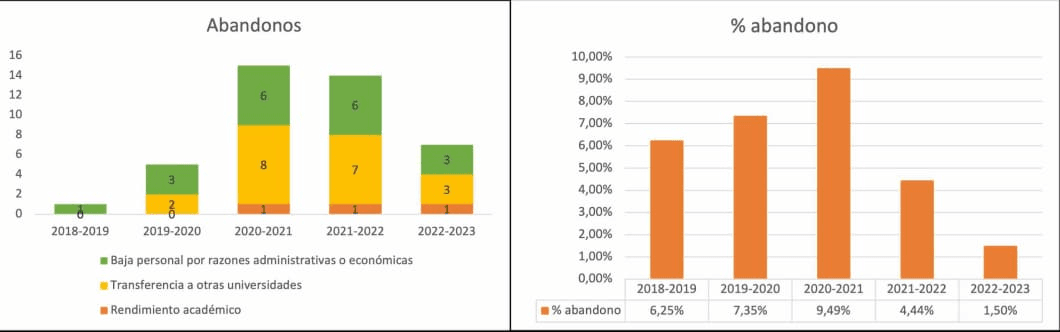
TASA DE ABANDONOS
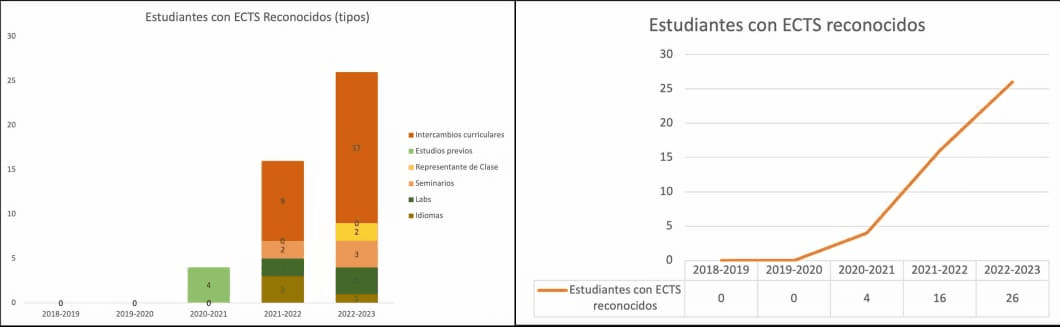
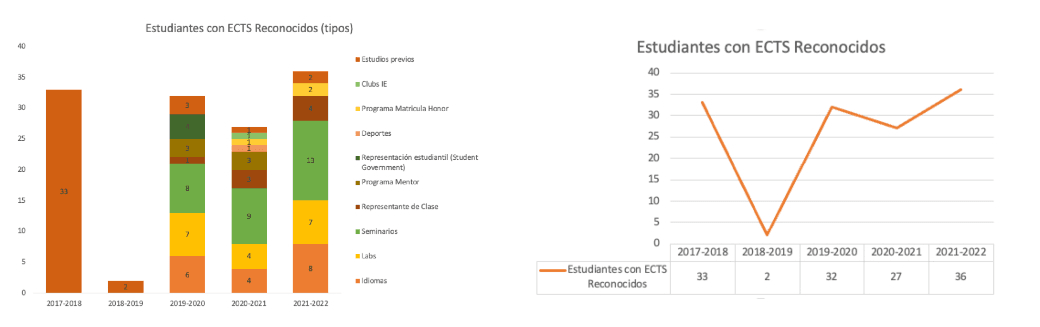
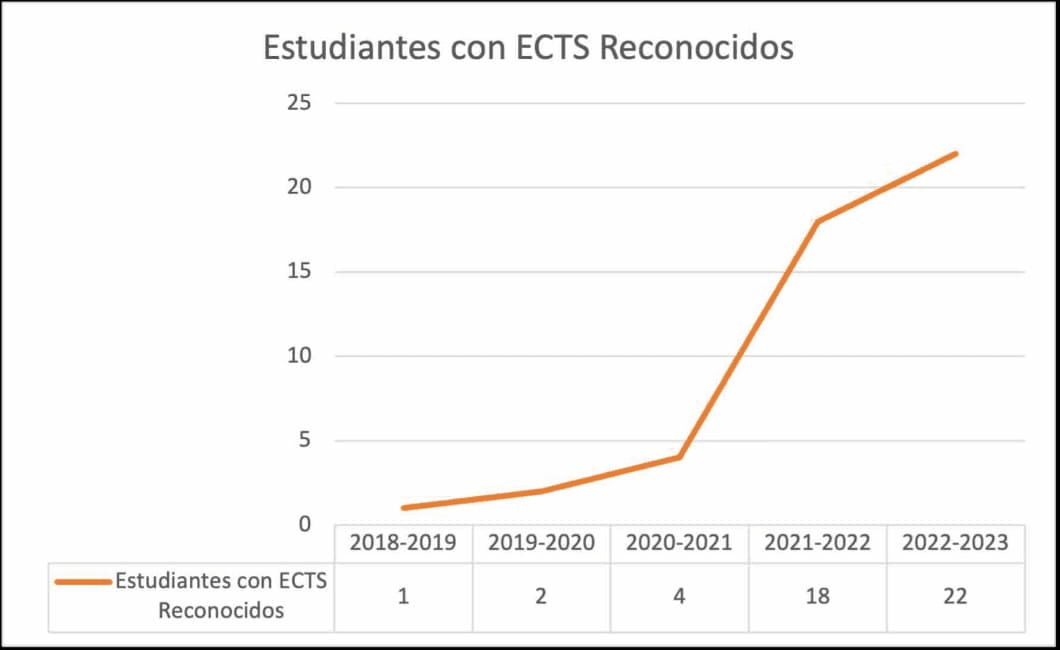
ESTUDIANTES CON ECTS RECONOCIDOS
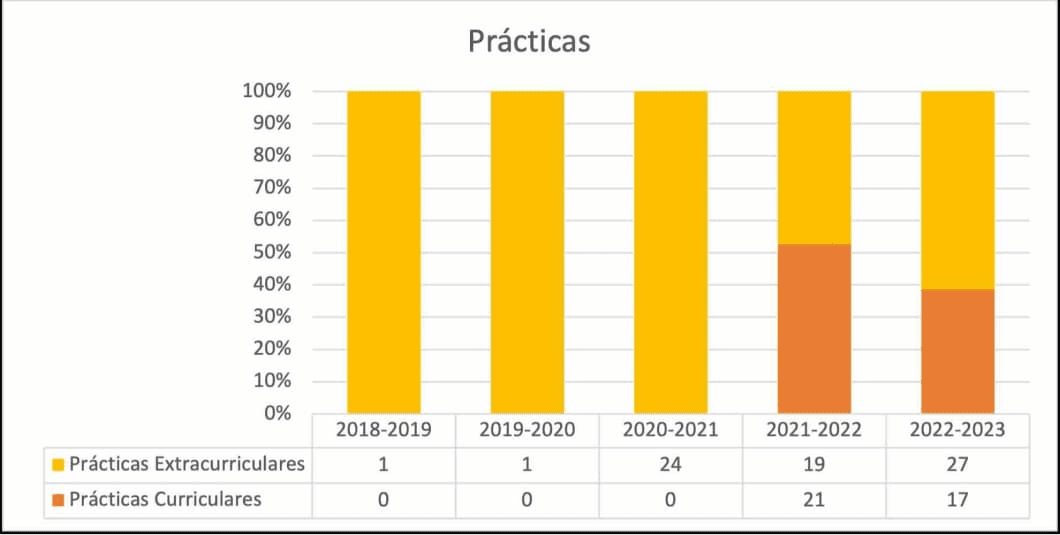
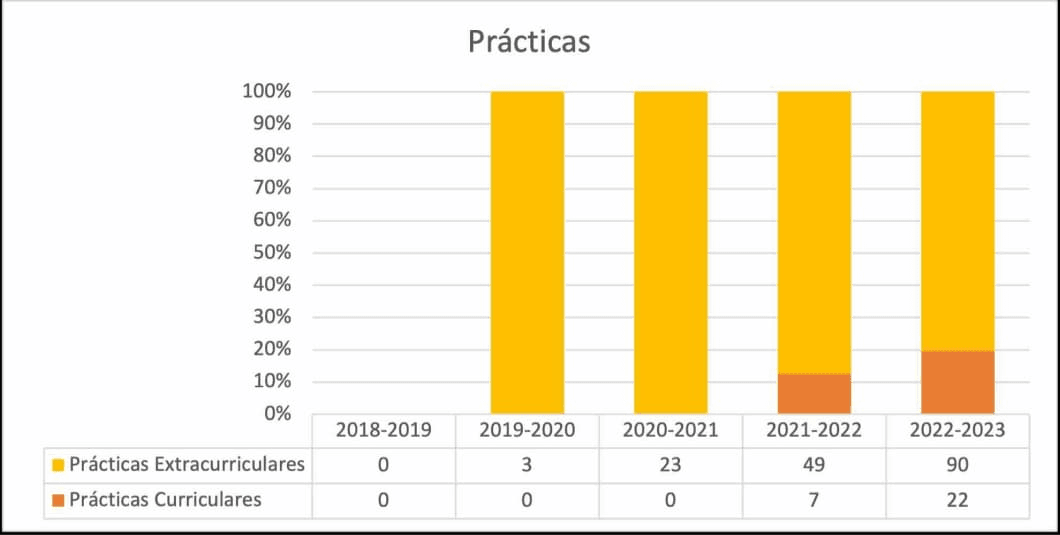
PRÁCTICAS
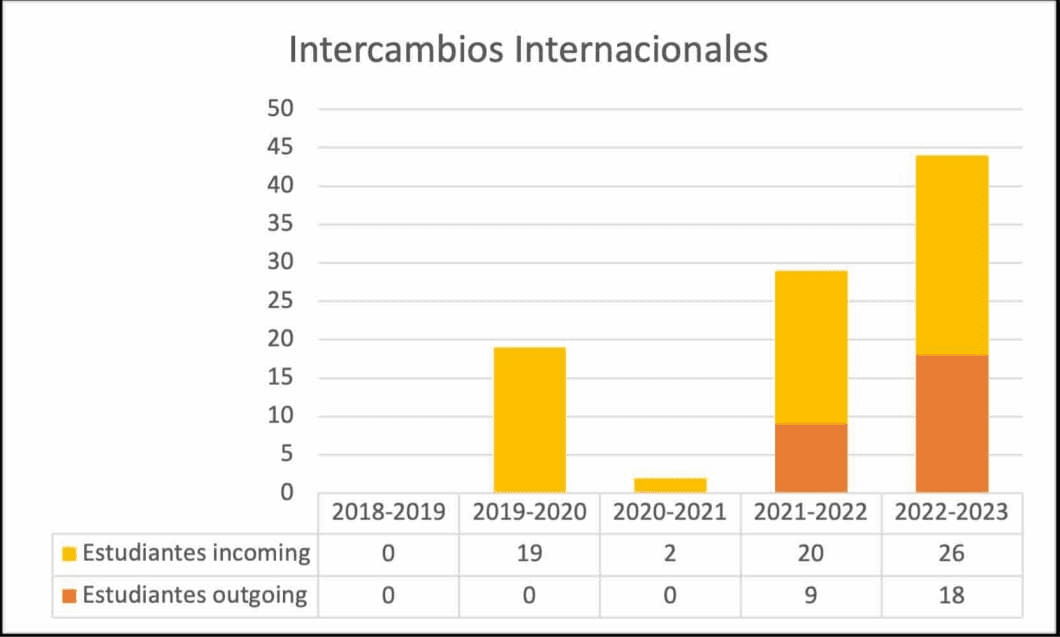
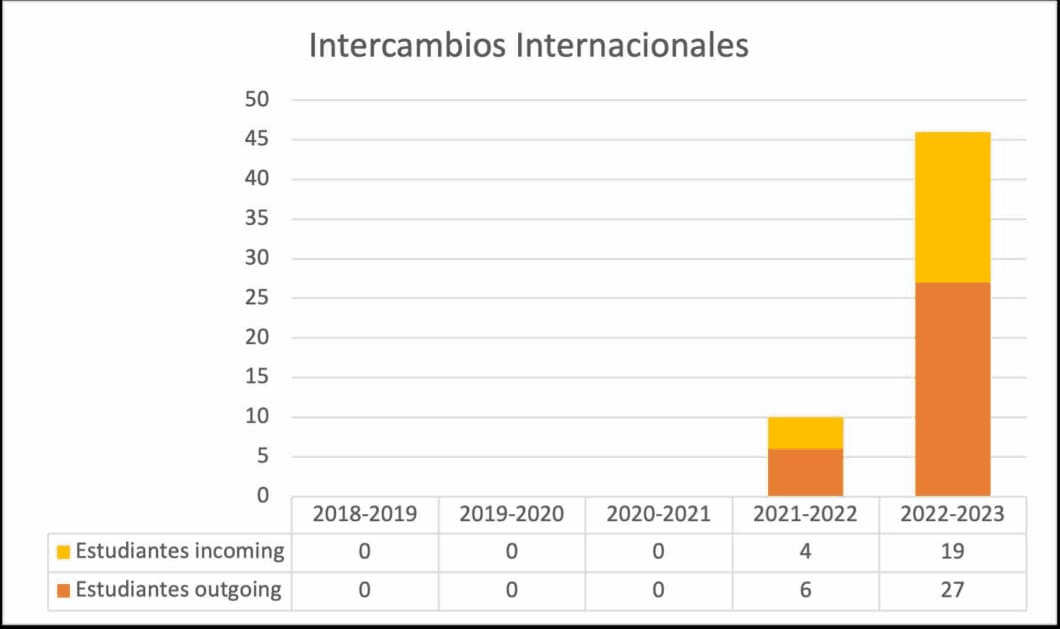
INTERCAMBIOS INTERNACIONALES
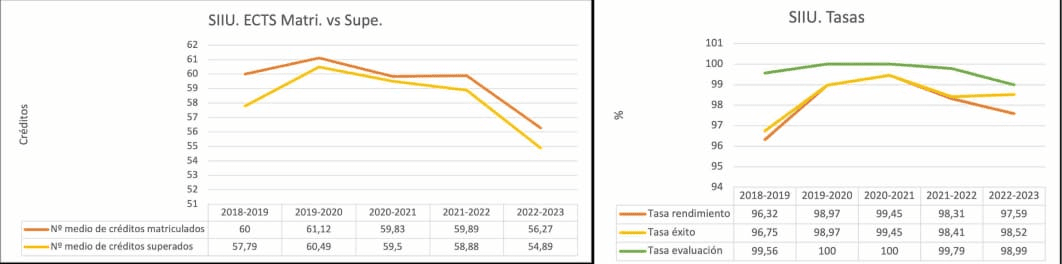
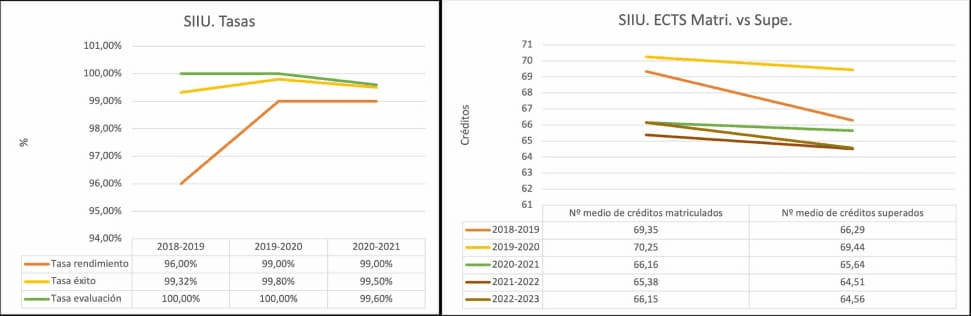
SIIU
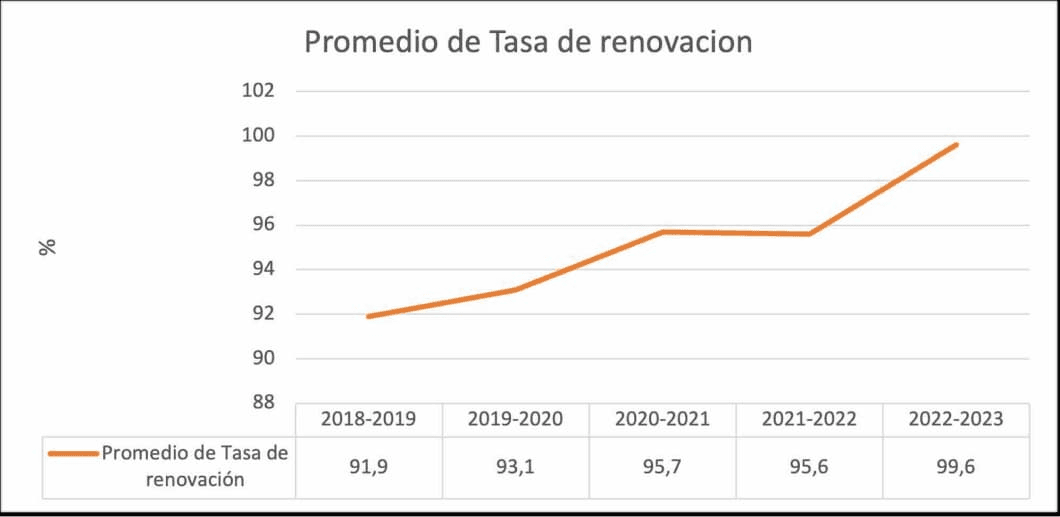
PROMEDIO DE TASA DE RENOVACIÓN
INDICADORES
Grado en Comunicación y Medios Digitales
PLAZAS
NOTA MEDIA
ACCESO
NACIONALIDAD Y GÉNERO
ABANDONOS
ESTUDIANTES CON ECTS RECONOCIDOS
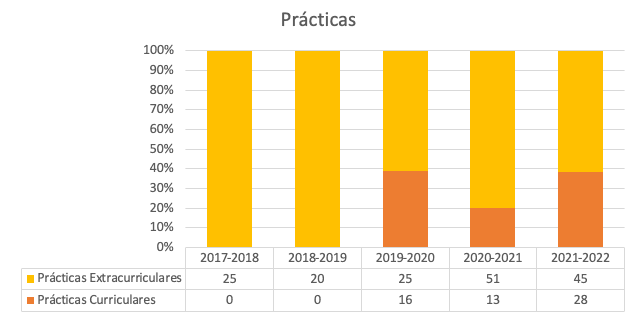
PRÁCTICAS
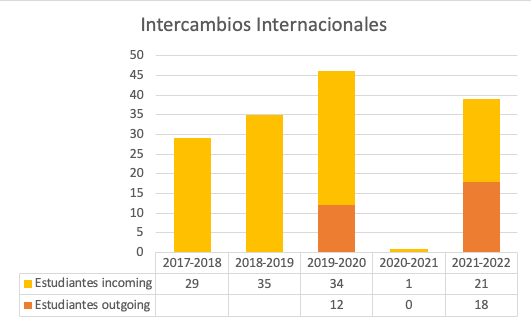
INTERCAMBIOS INTERNACIONALES
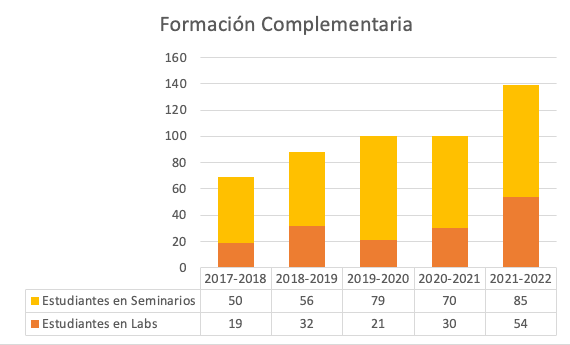
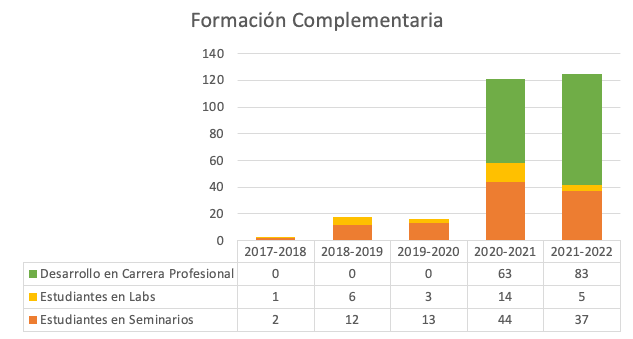
FORMACIÓN COMPLEMENTARIA
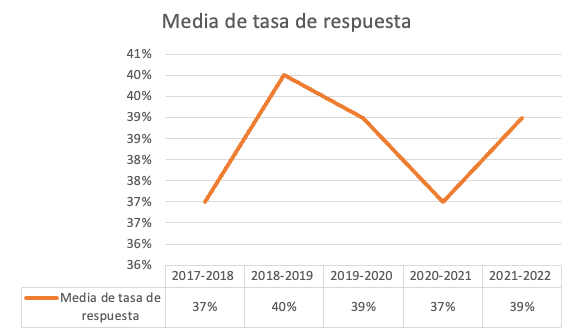
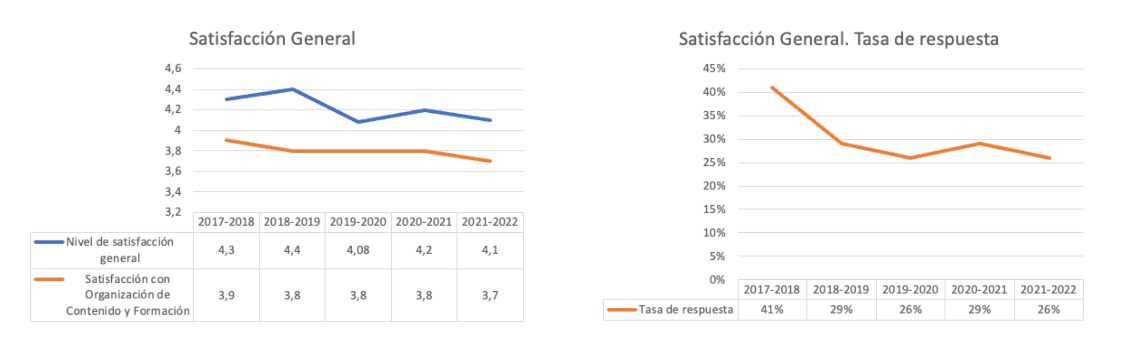
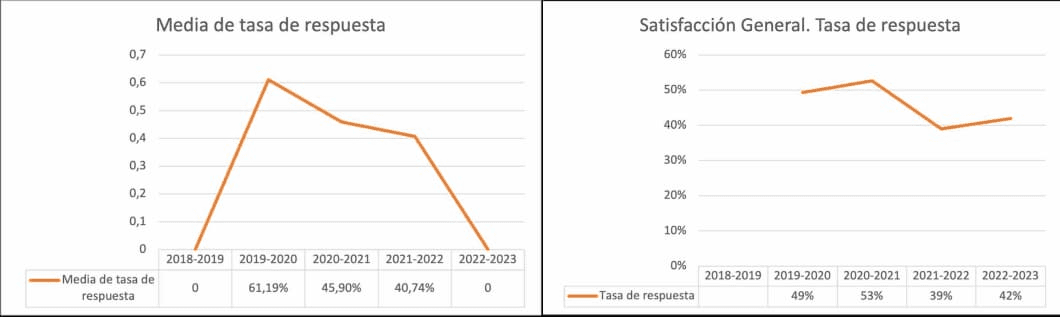
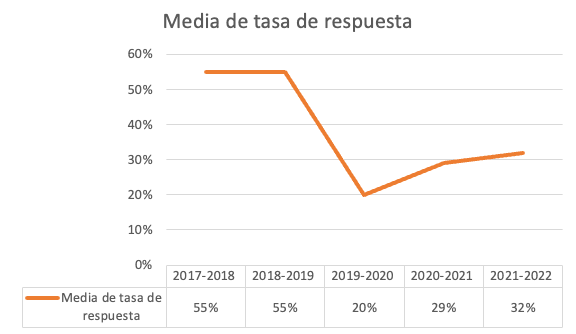
TASA DE RESPUESTA
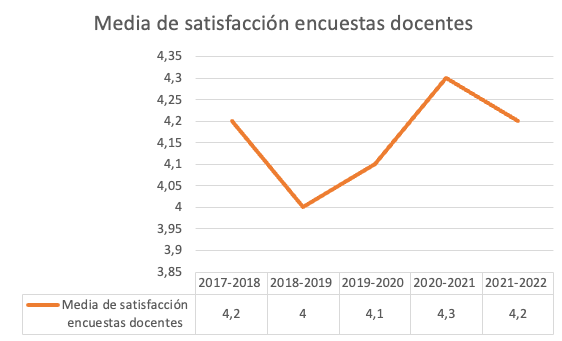
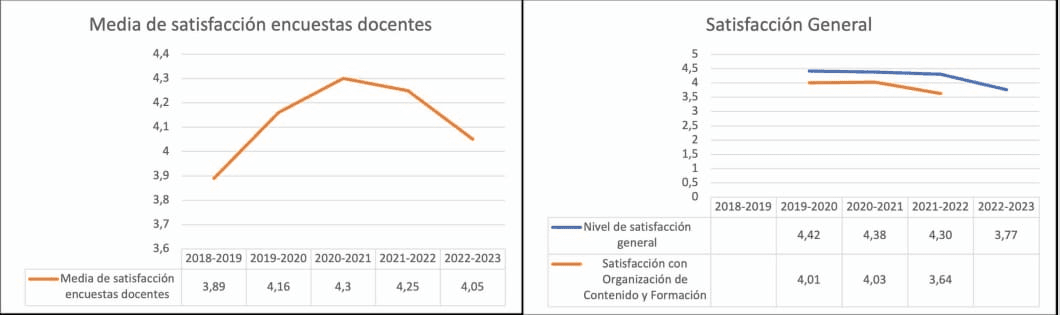
SATISFACCIÓN DOCENTE
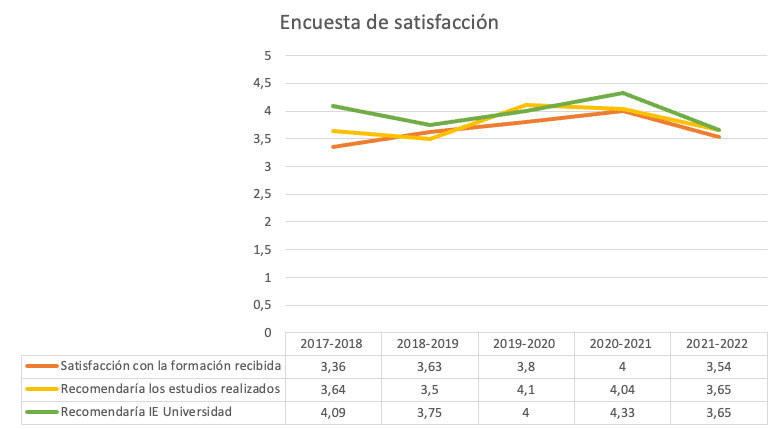
SATISFACCIÓN GENERAL
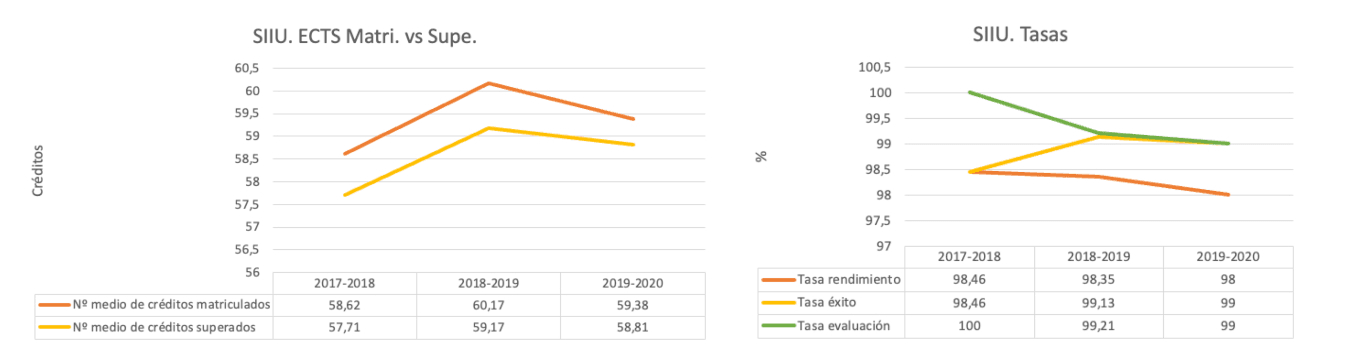
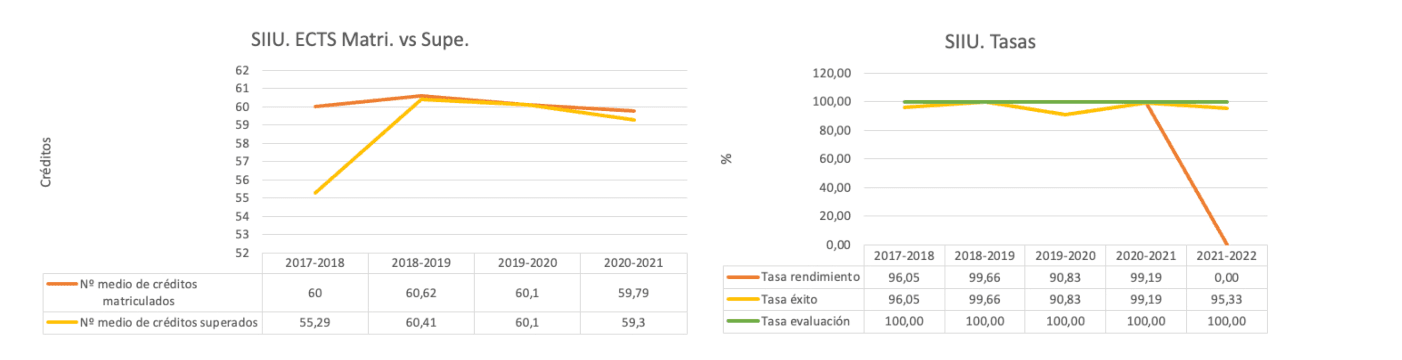
SIIU
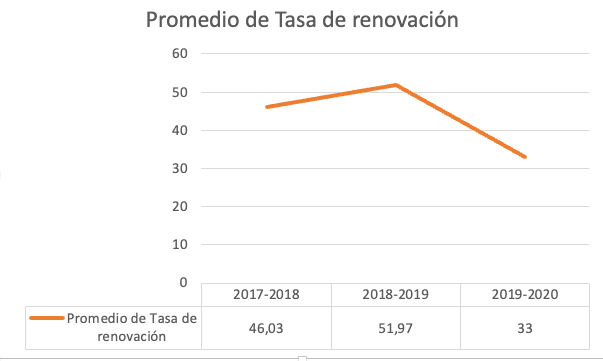
TASA DE RENOVACIÓN
INDICADORES
Grado En Computación E Inteligencia Artificial
GRADO EN DATOS Y ANALÍTICA DE NEGOCIO
PLAZAS
NOTA MEDIA
ACCESO
NACIONALIDAD Y GÉNERO
TASA DE ABANDONOS
ESTUDIANTES CON ECTS RECONOCIDOS
PRÁCTICAS
INTERCAMBIOS INTERNACIONALES
SIIU
ENCUESTAS DE SATISFACCIÓN
TASA DE RESPUESTA
INDICADORES
Grado En Derecho
Grado en Diseño
PLAZAS
NOTA MEDIA
ACCESO
NACIONALIDAD Y GÉNERO
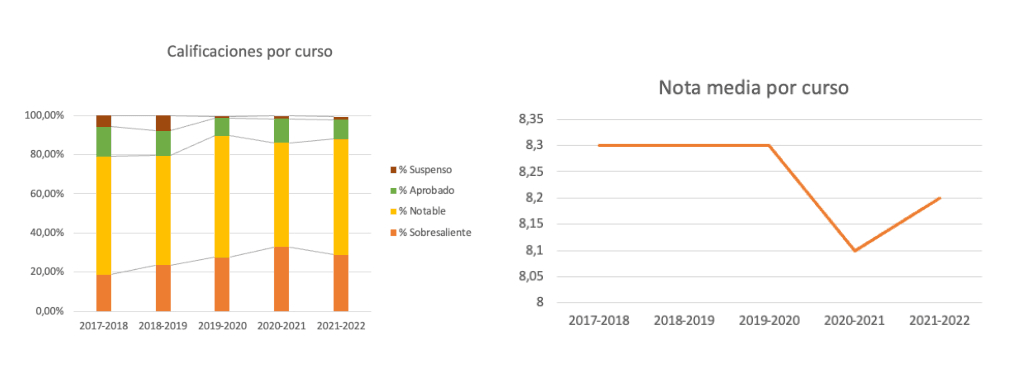
CALIFICACIONES Y NOTA MEDIA POR CURSO
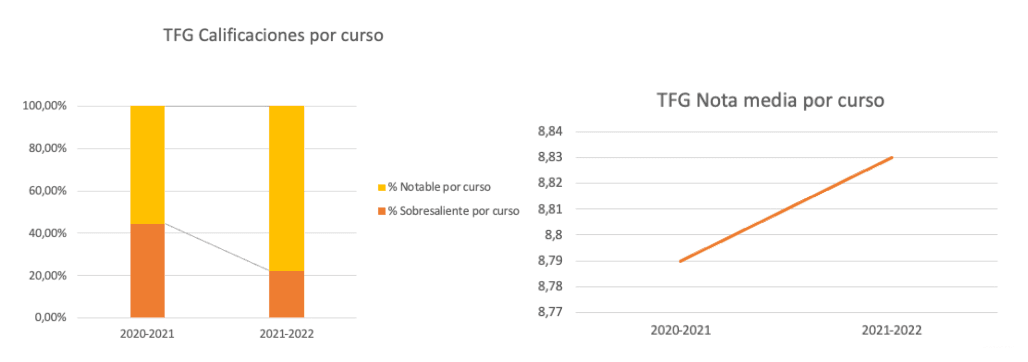
TFG - CALIFICACIONES Y NOTA MEDIA POR CURSO
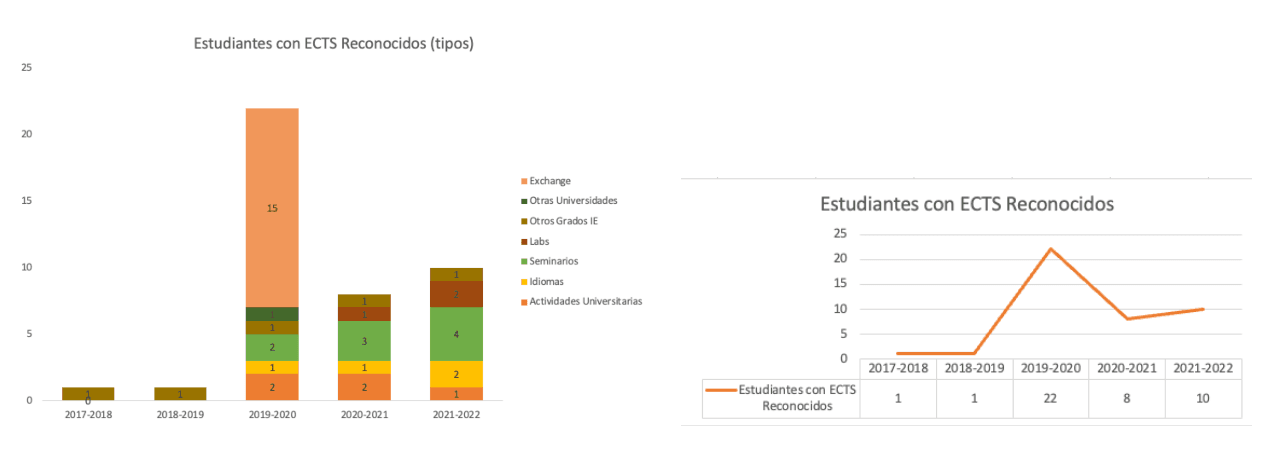
ESTUDIANTES CON ECTS RECONOCIDOS
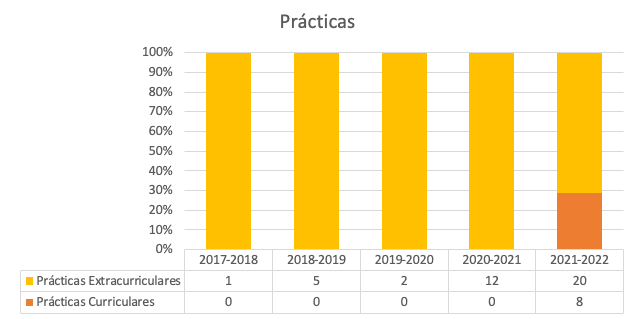
PRÁCTICAS
FORMACIÓN COMPLEMENTARIA
TASA DE RESPUESTA
ENCUESTA DE SATISFACCIÓN
SIIU
INDICADORES
Grado en Economía
MATRÍCULA TOTAL
ESTUDIANTES DE NUEVO INGRESO
EGRESADOS
ESTUDIANTES DE NUEVO INGRESO. GÉNERO
ESTUDIANTES DE NUEVO INGRESO. NACIONALIDAD
CALIFICACIONES POR CURSO
NOTA MEDIA
CALIFICACIONES TFG
NOTA EXPEDIENTE EGRESADOS
VÍAS DE ACCESO
MOVILIDAD INTERNACIONAL
NOTA MEDIA DE ACCESO
INDICADORES
EMPLEO EGRESADOS
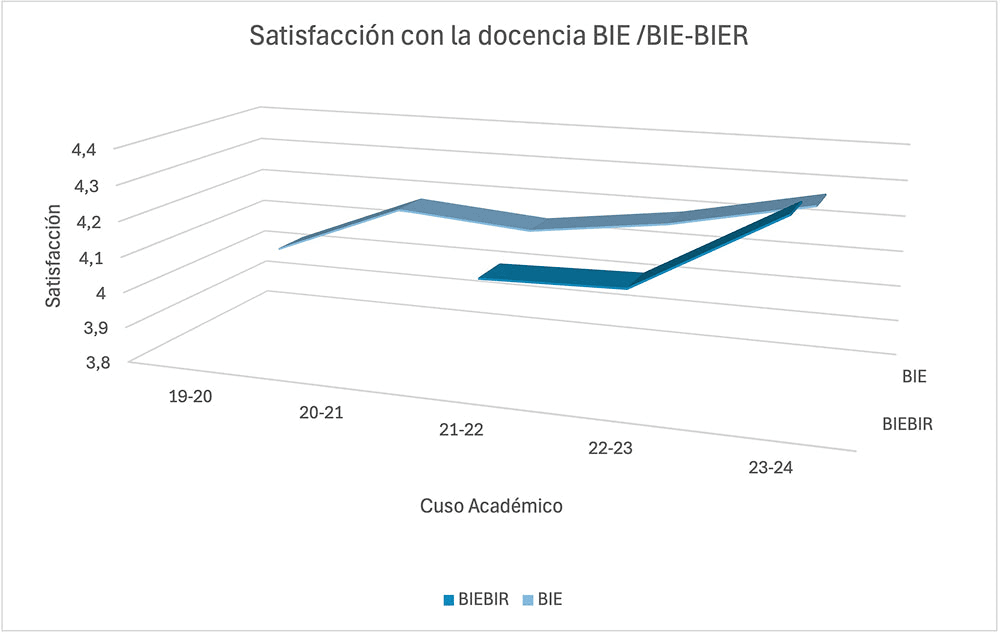
SATISFACCIÓN CON LA DOCENCIA
Grado en Estudios de Arquitectura
Grado en Filosofía, Política, Derecho y Economía
Grado en Relaciones Internacionales
PLAZAS
NOTA MEDIA
ACCESO
NACIONALIDAD Y GÉNERO
TASA DE ABANDONOS
ESTUDIANTES CON ECTS RECONOCIDOS
PRÁCTICAS
INTERCAMBIOS INTERNACIONALES
SIIU
PROMEDIO DE TASA DE RENOVACIÓN
INDICADORES
Master ejecutivo EN ADMINISTRACIÓN DE EMPRESAS
Máster en Administración de Empresas para Arquitectura y Diseño
Máster en administración internacional de Empresas
Máster en Asesoría Fiscal de Empresas
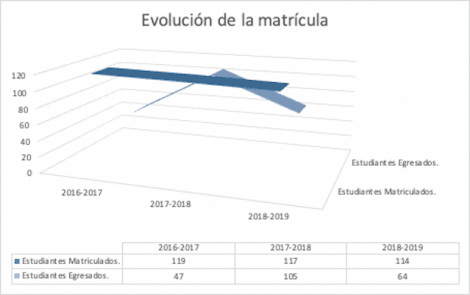
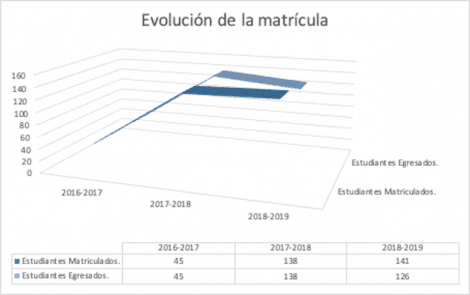
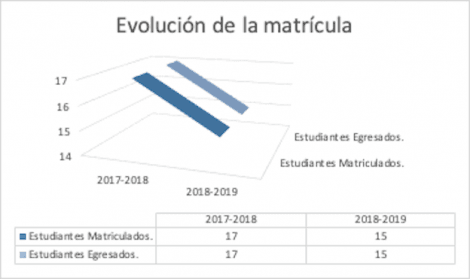
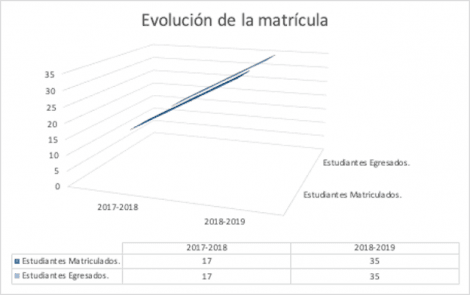
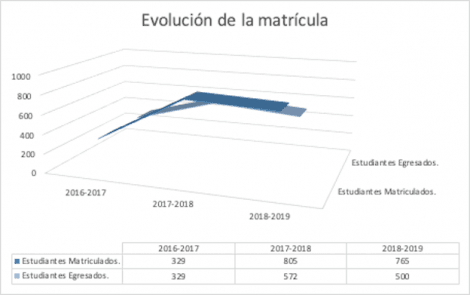
EVOLUCIÓN DE MATRÍCULA
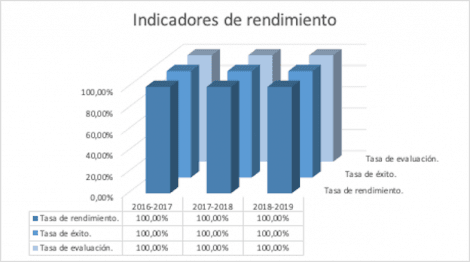
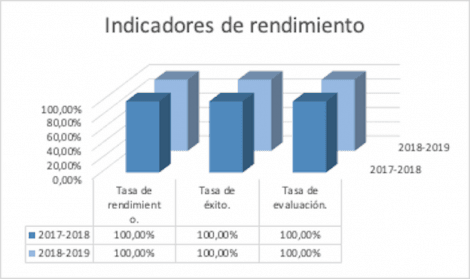
INDICADORES DE RENDIMIENTO
Máster en Asesoría Jurídica de Empresas
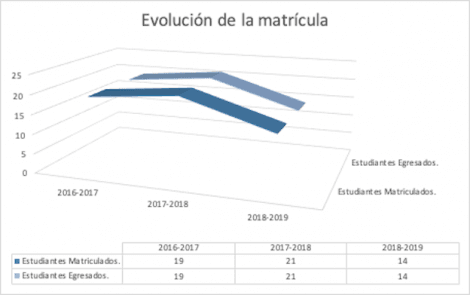
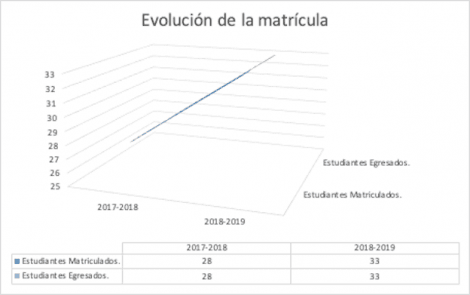
EVOLUCIÓN DE MATRÍCULA
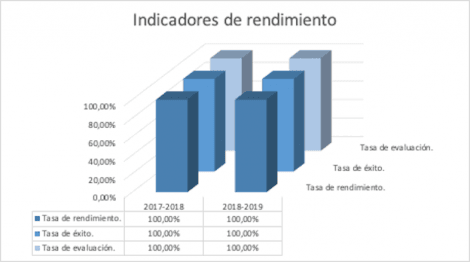
INDICADORES DE RENDIMIENTO
Máster en Asesoría Jurídica Internacional
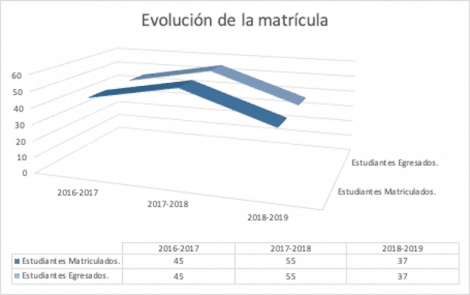
EVOLUCIÓN DE MATRÍCULA
INDICADORES DE RENDIMIENTO
Máster en Creación y Gestión de Medios Visuales
EVOLUCIÓN DE MATRÍCULA
INDICADORES DE RENDIMIENTO
Máster en Desarrollo del Talento y Recursos Humanos
EVOLUCIÓN DE LA MATRÍCULA
INDICADORES DE RENDIMIENTO
Máster en Desarrollo Inmobiliario y Ciudad
EVOLUCIÓN DE MATRÍCULA
INDICADORES DE RENDIMIENTO
Máster en Desarrollo Internacional
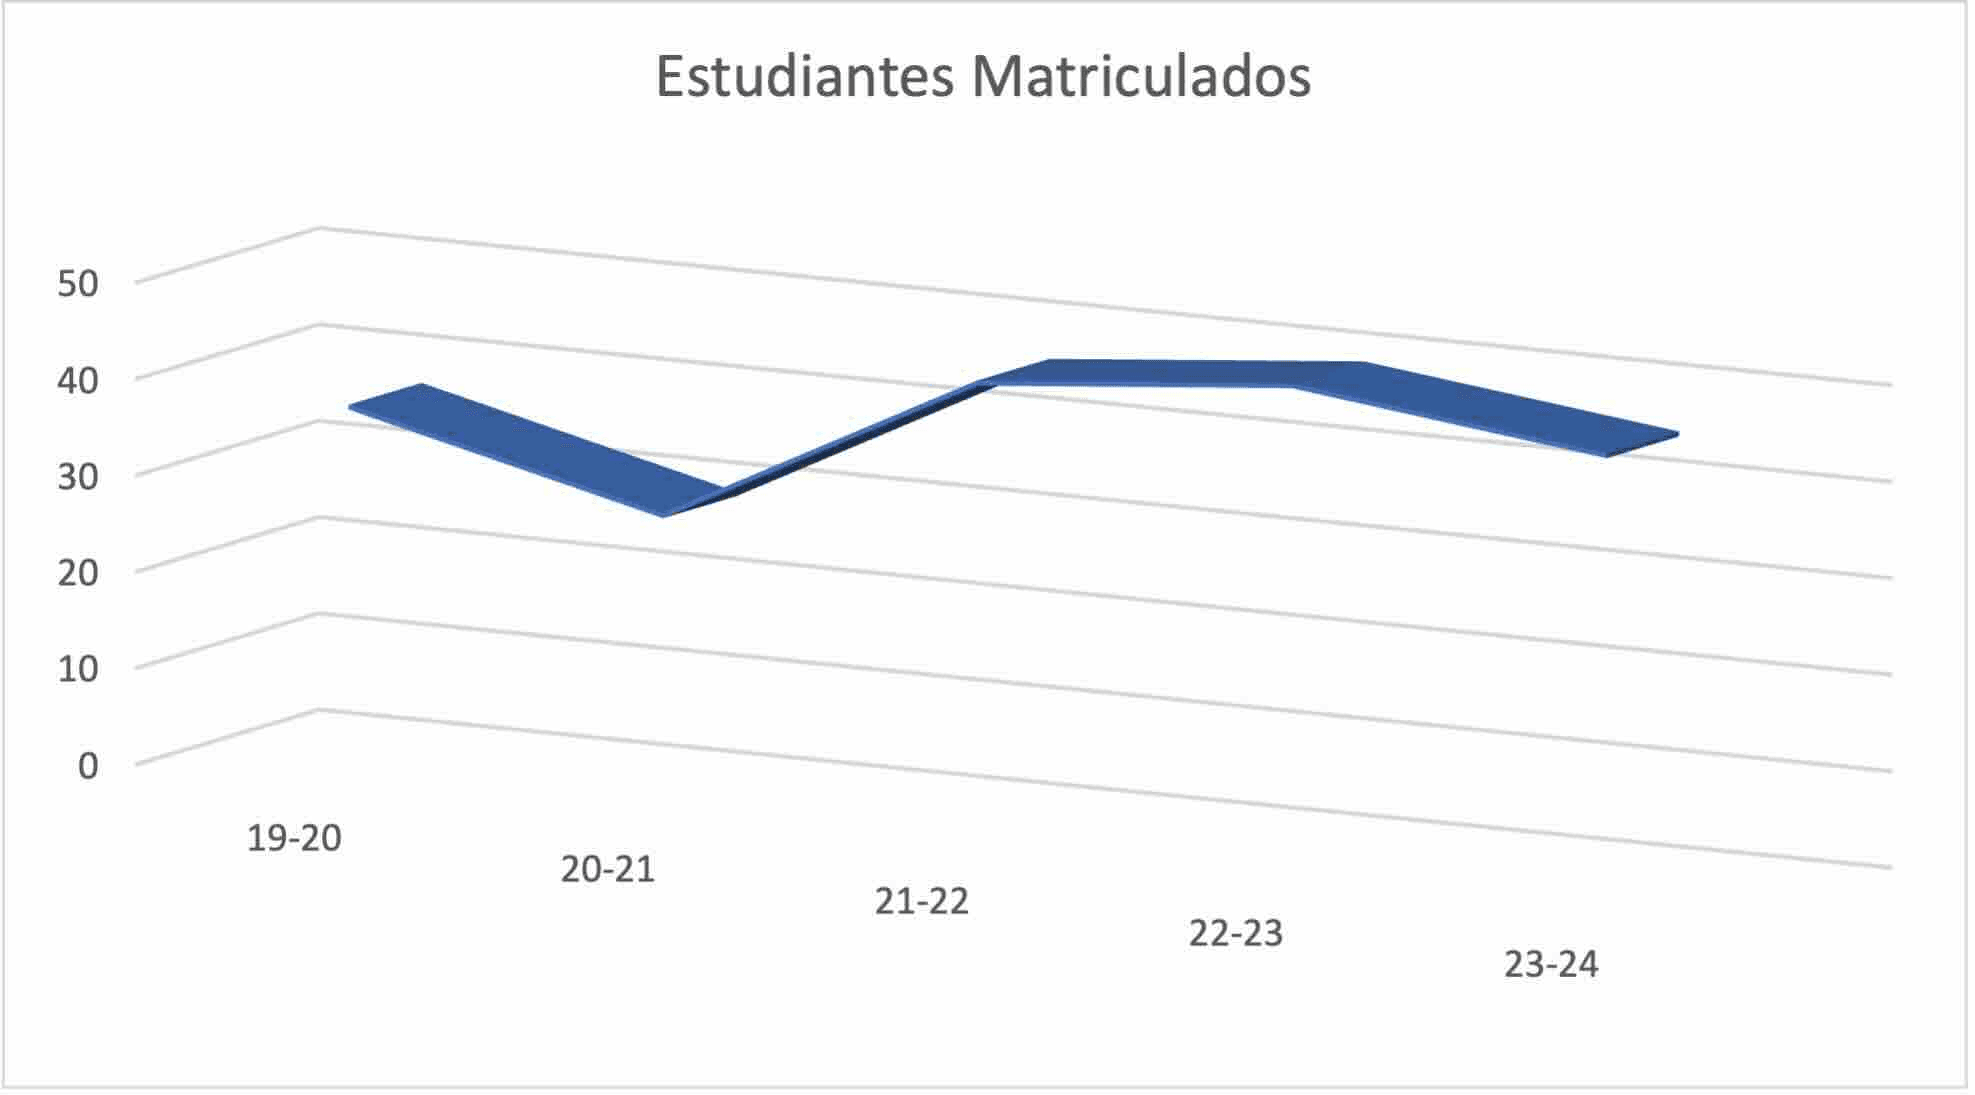
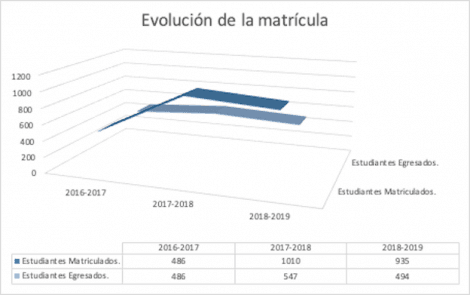
ESTUDIANTES MATRICULADOS
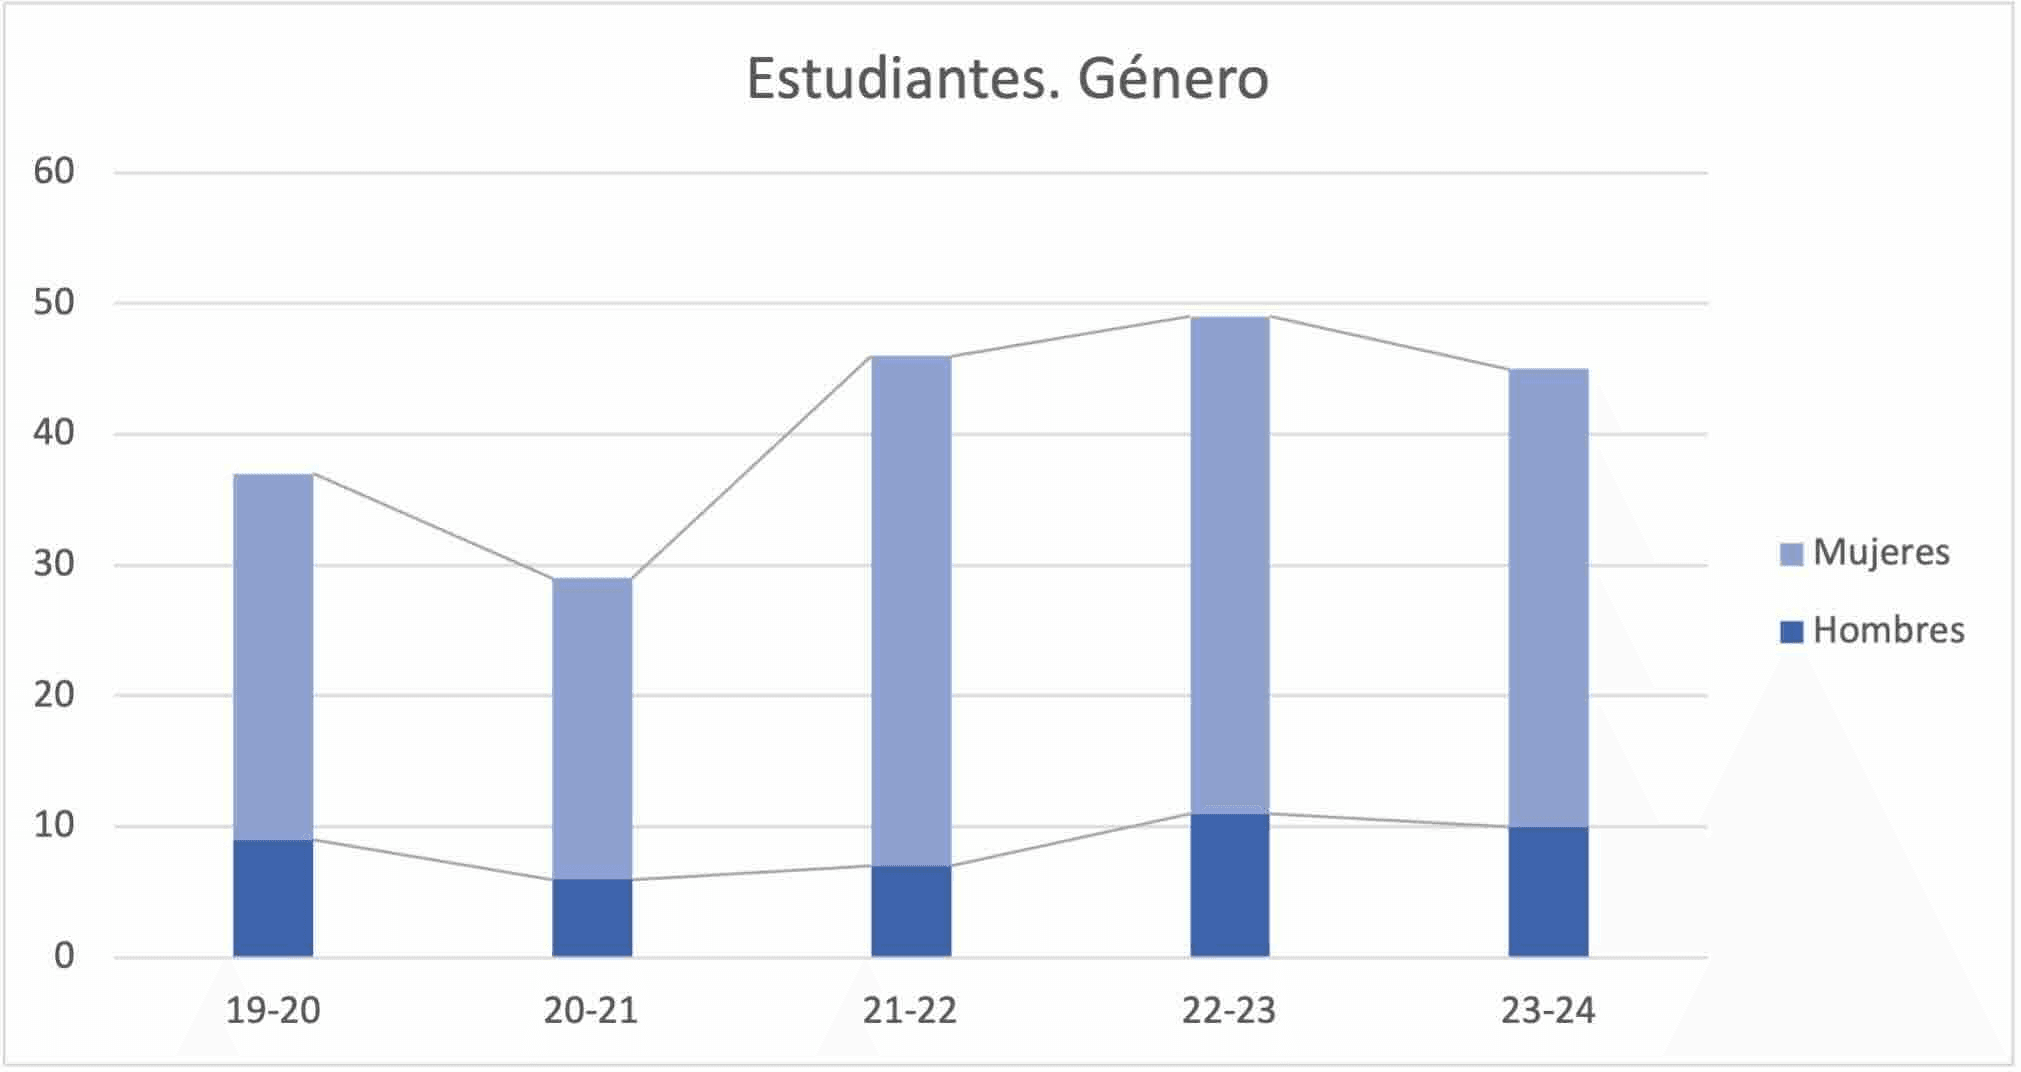
ESTUDIANTES GÉNERO
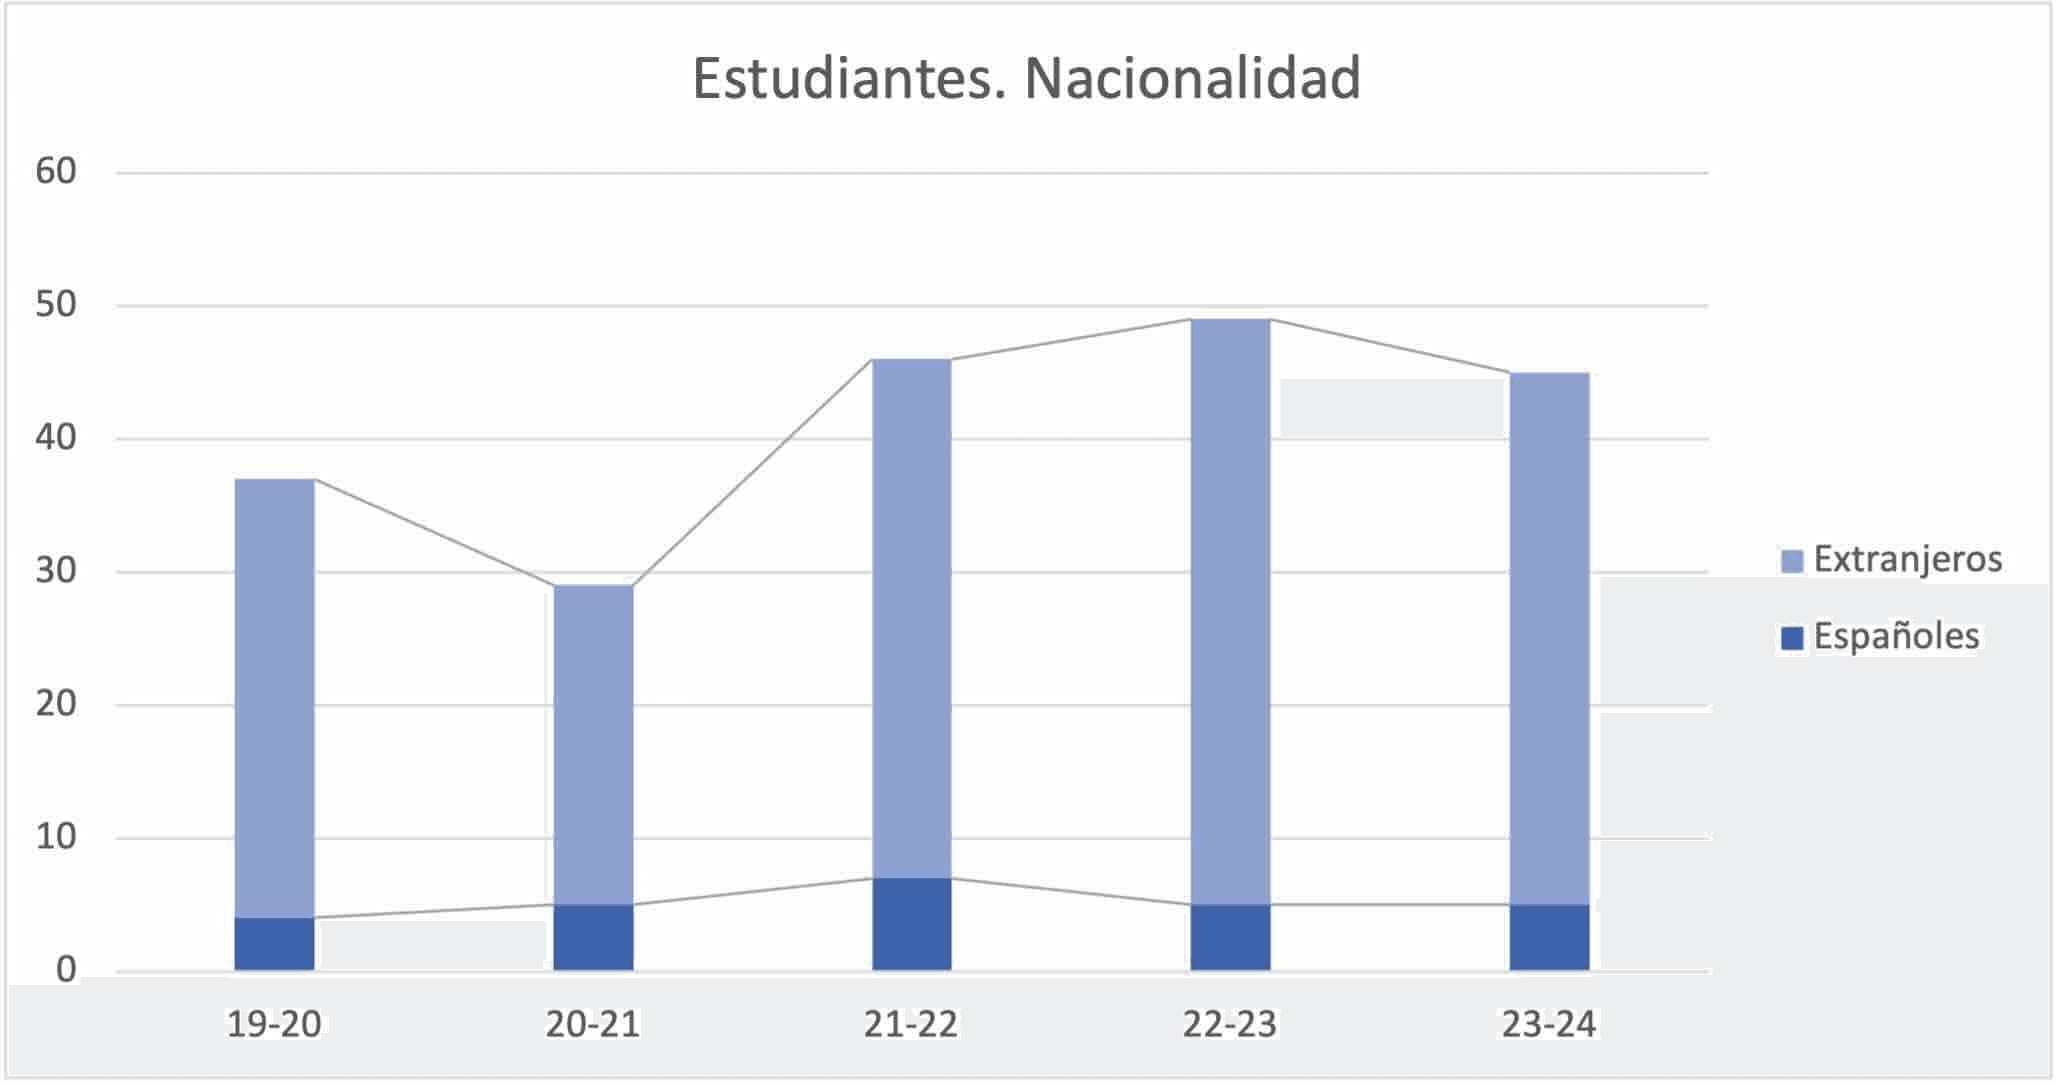
ESTUDIANTES NACIONALIDAD
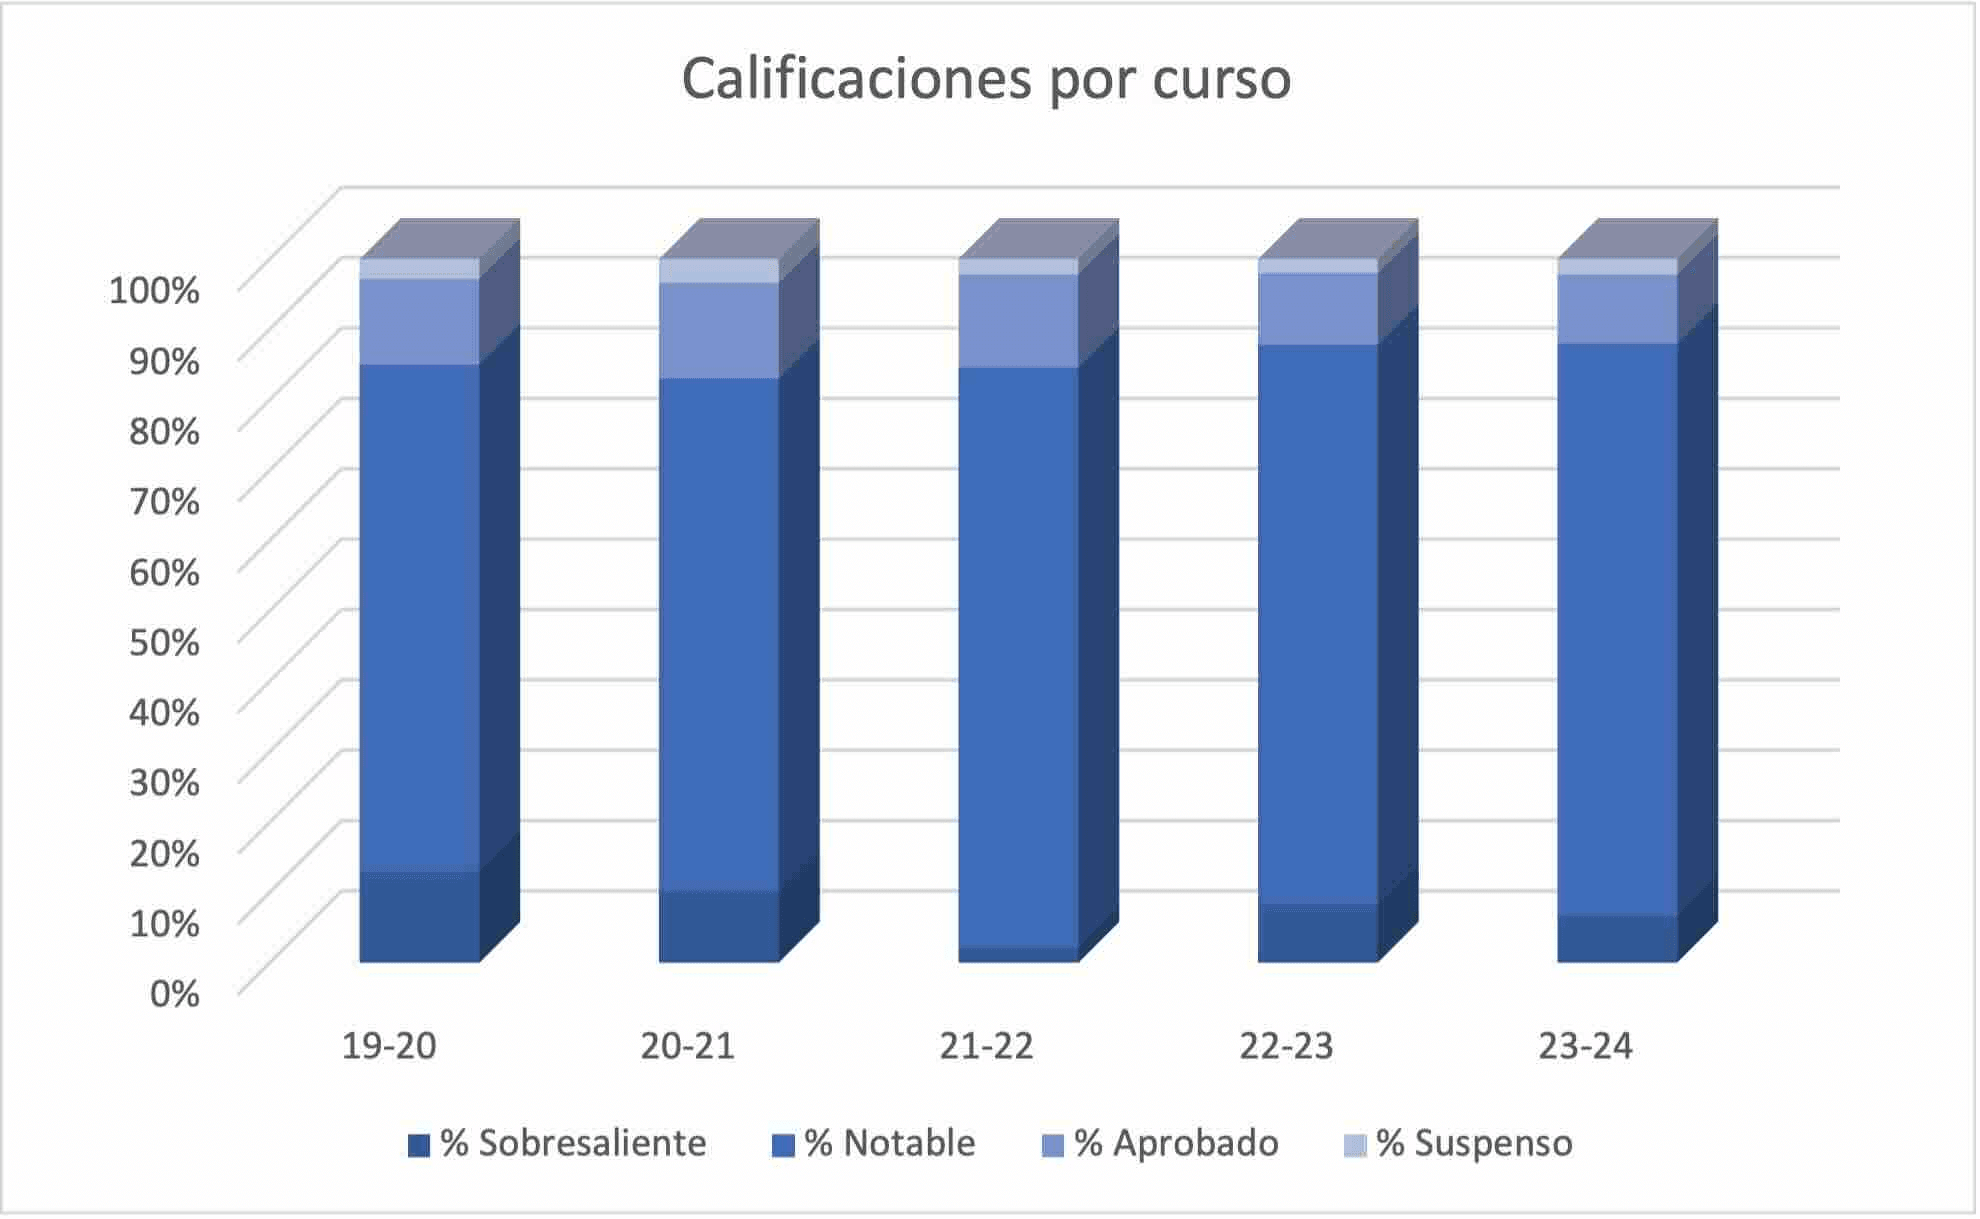
CALIFICACIONES POR CURSO
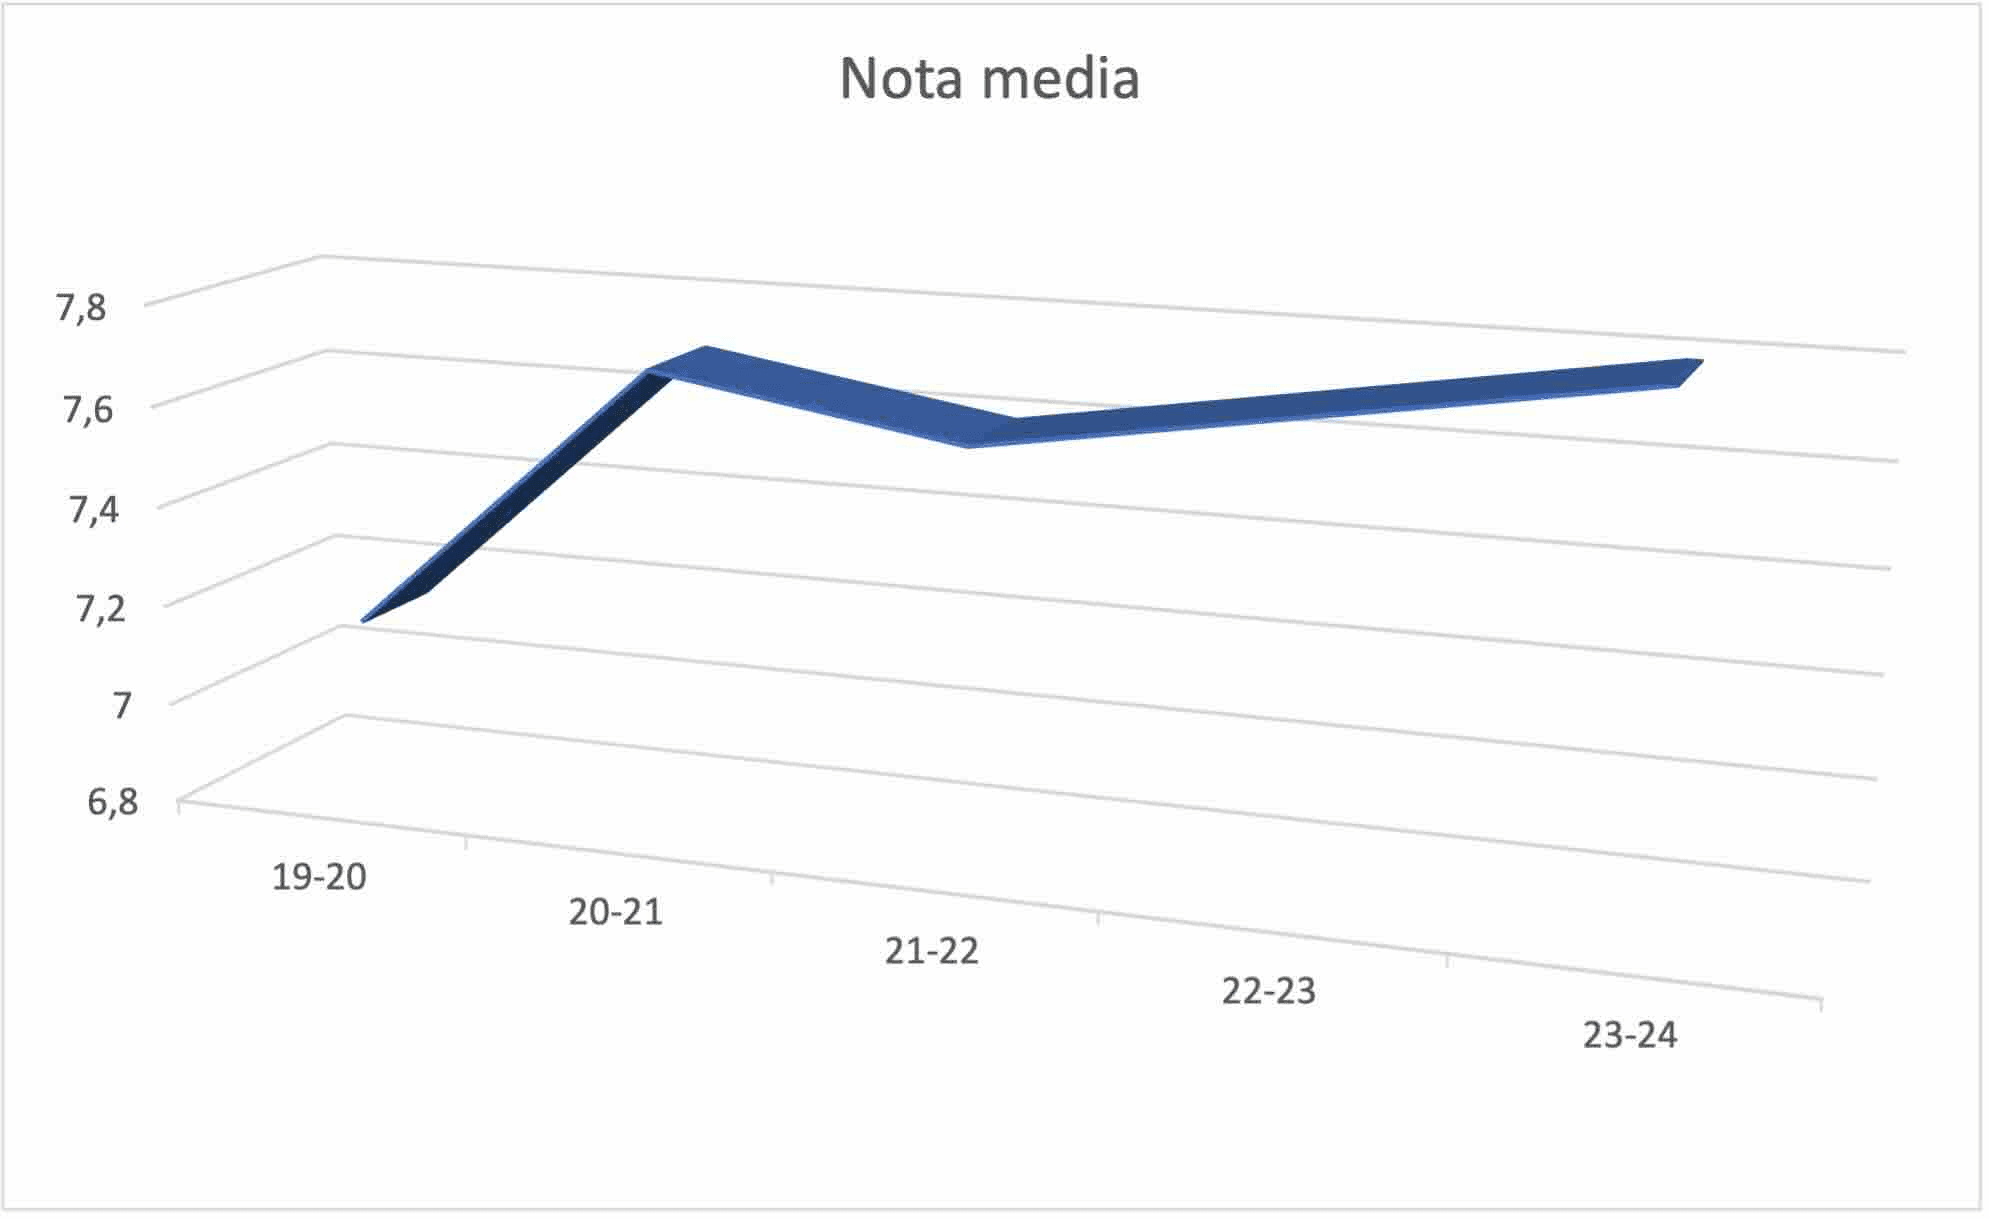
NOTA MEDIA
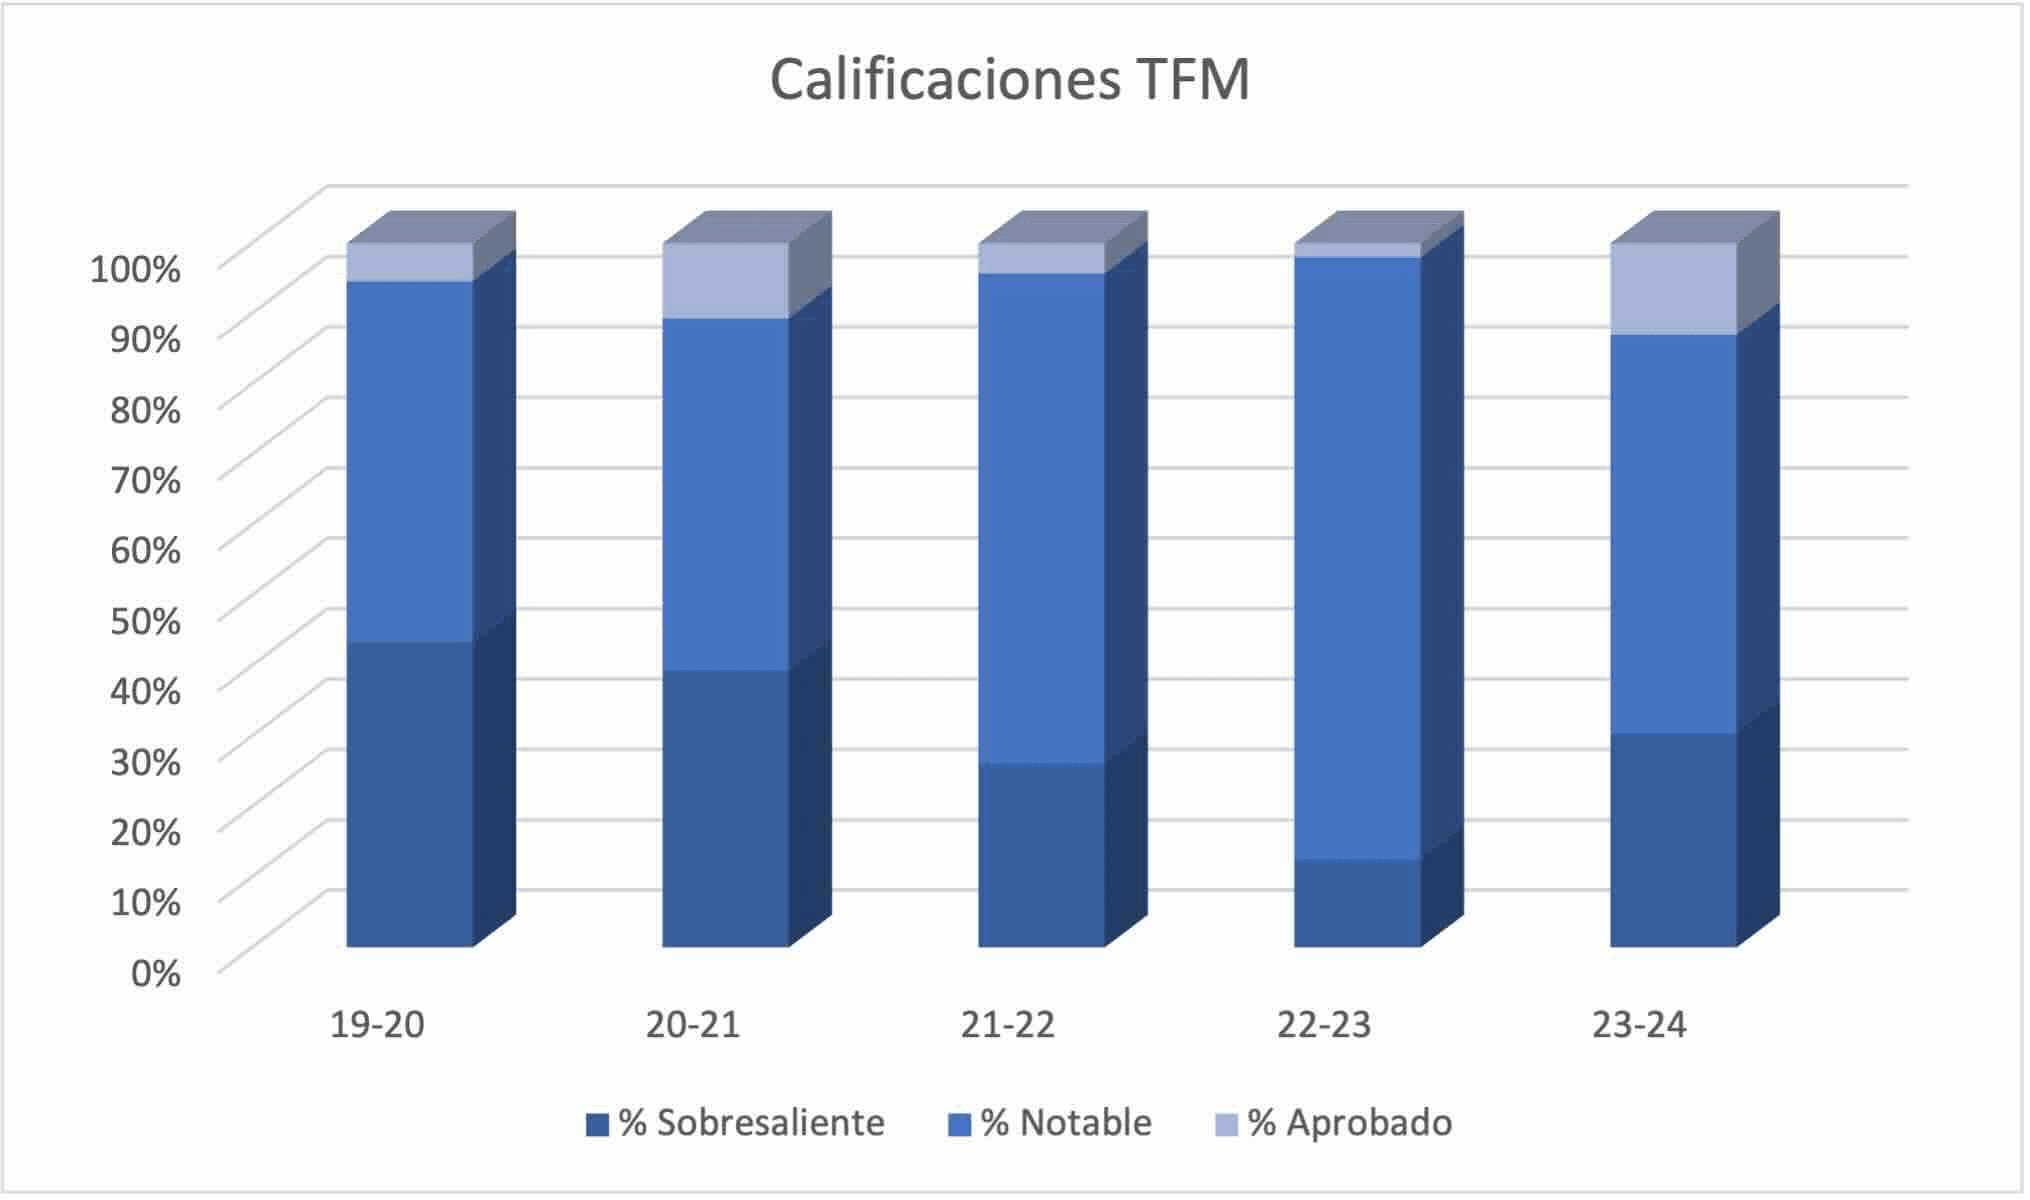
CALIFICACIONES TFM
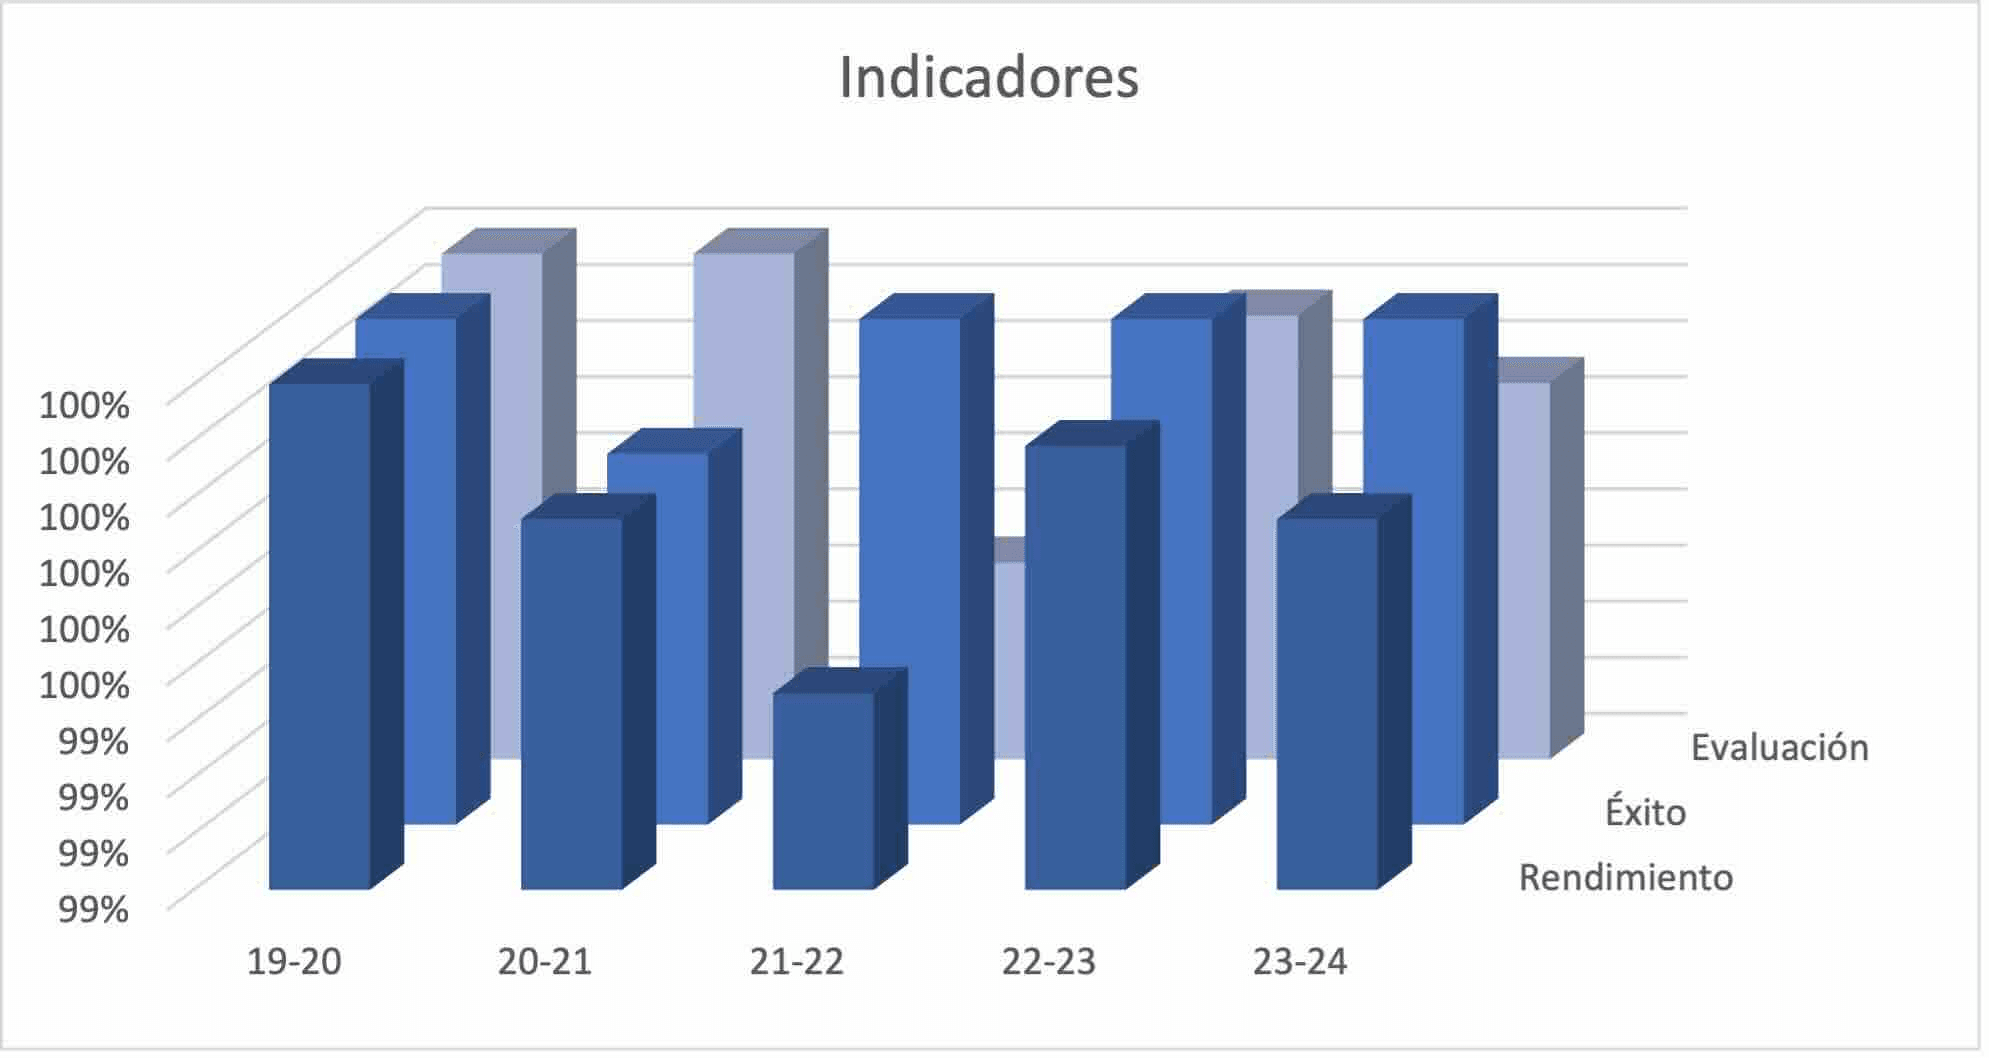
INDICADORES
Máster en Dirección de Empresas
EVOLUCIÓN DE MATRÍCULA
INDICADORES DE RENDIMIENTO
Máster en Experiencia de Consumidor e Innovación
EVOLUCIÓN DE MATRÍCULA
INDICADORES DE RENDIMIENTO
Máster en Gestión
EVOLUCIÓN DE LA MATRÍCULA
INDICADORES DE RENDIMIENTO
Máster en Metodología de Investigación en Ciencias Empresariales
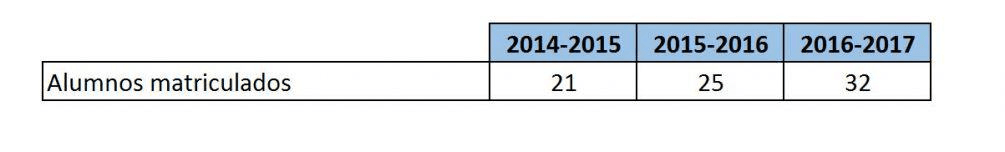
ESTUDIANTES MATRICULADOS
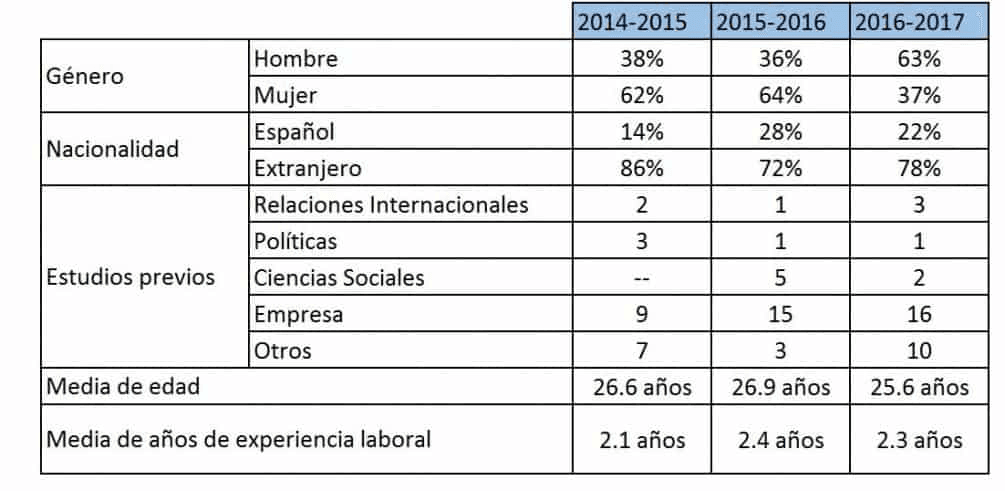
ESTUDIANTES DE NUEVO INGRESO. GÉNERO
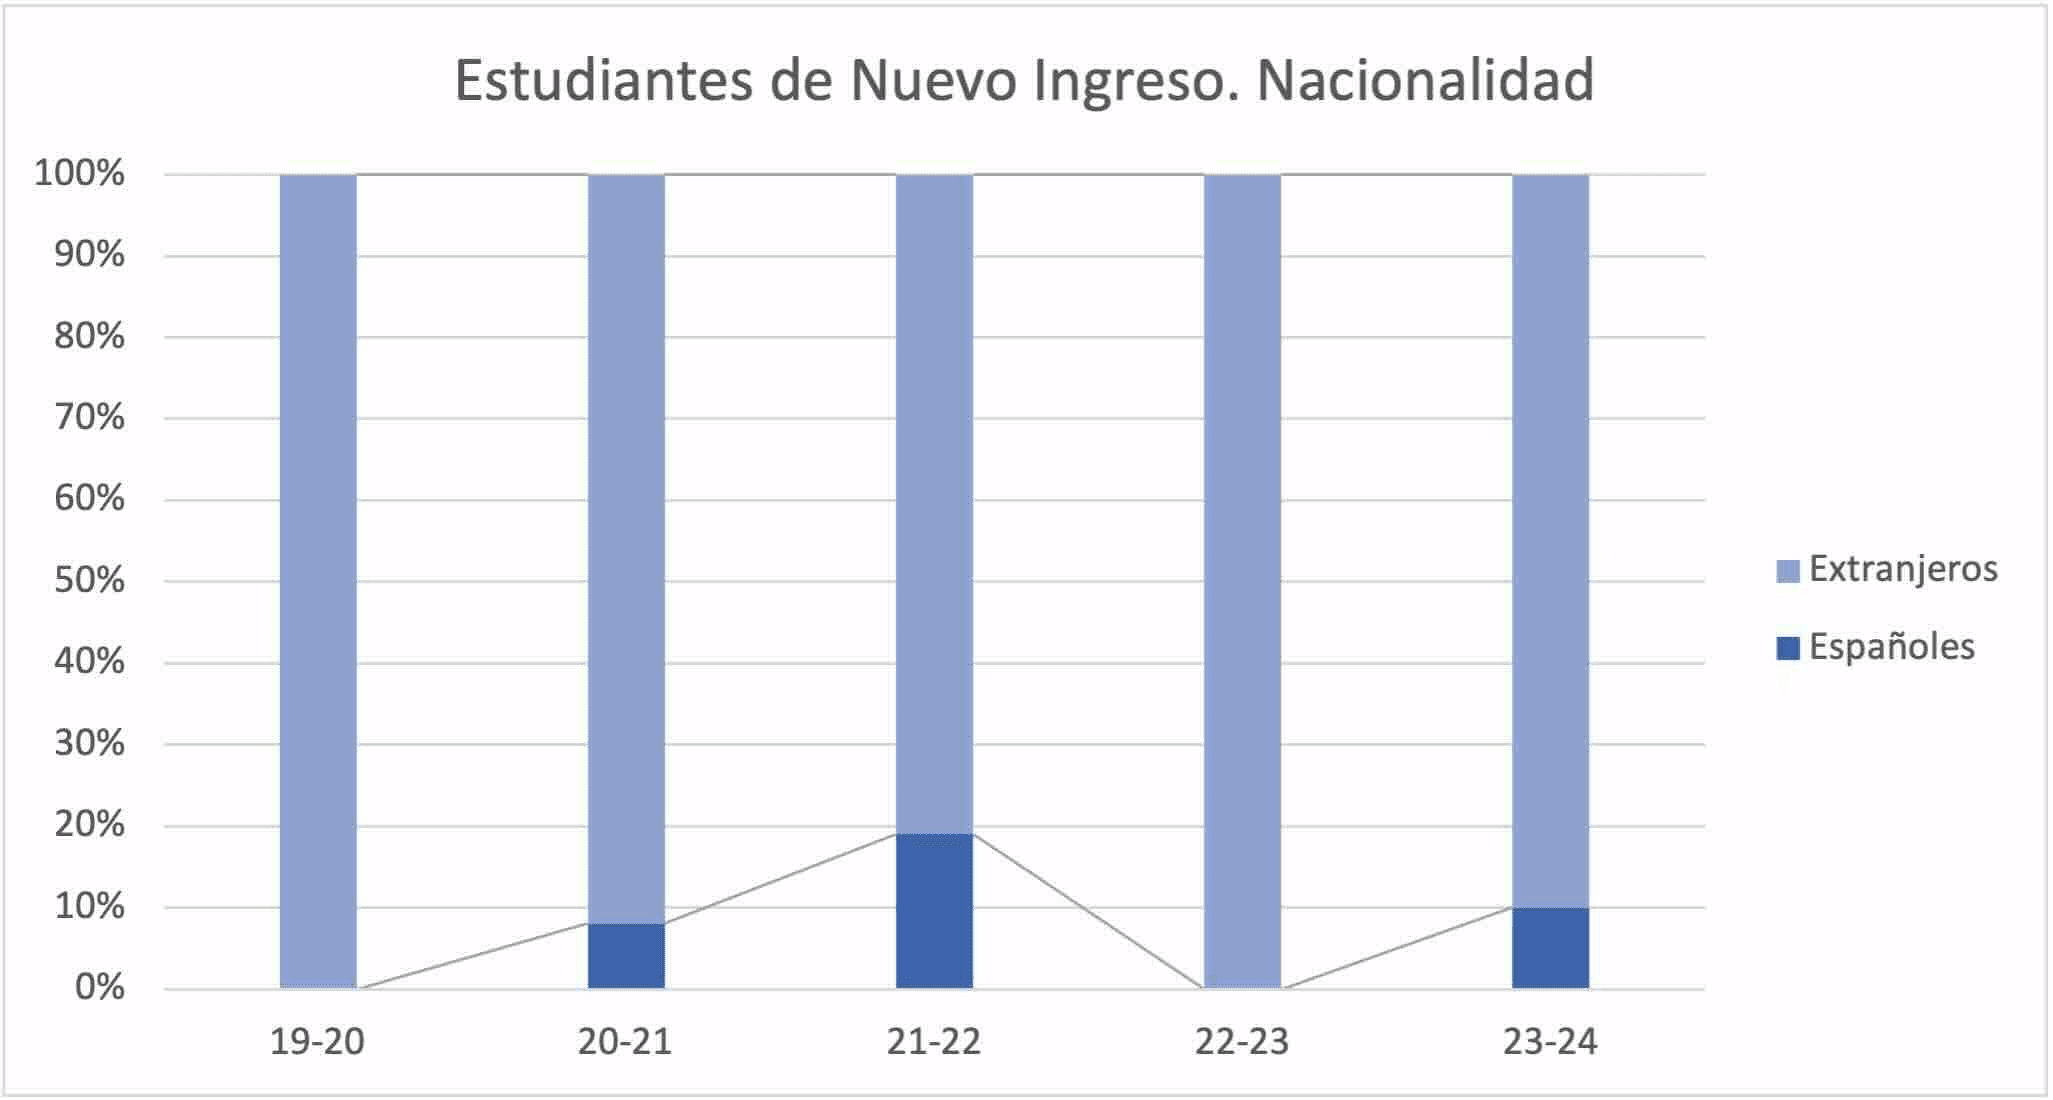
ESTUDIANTES DE NUEVO INGRESO. NACIONALIDAD
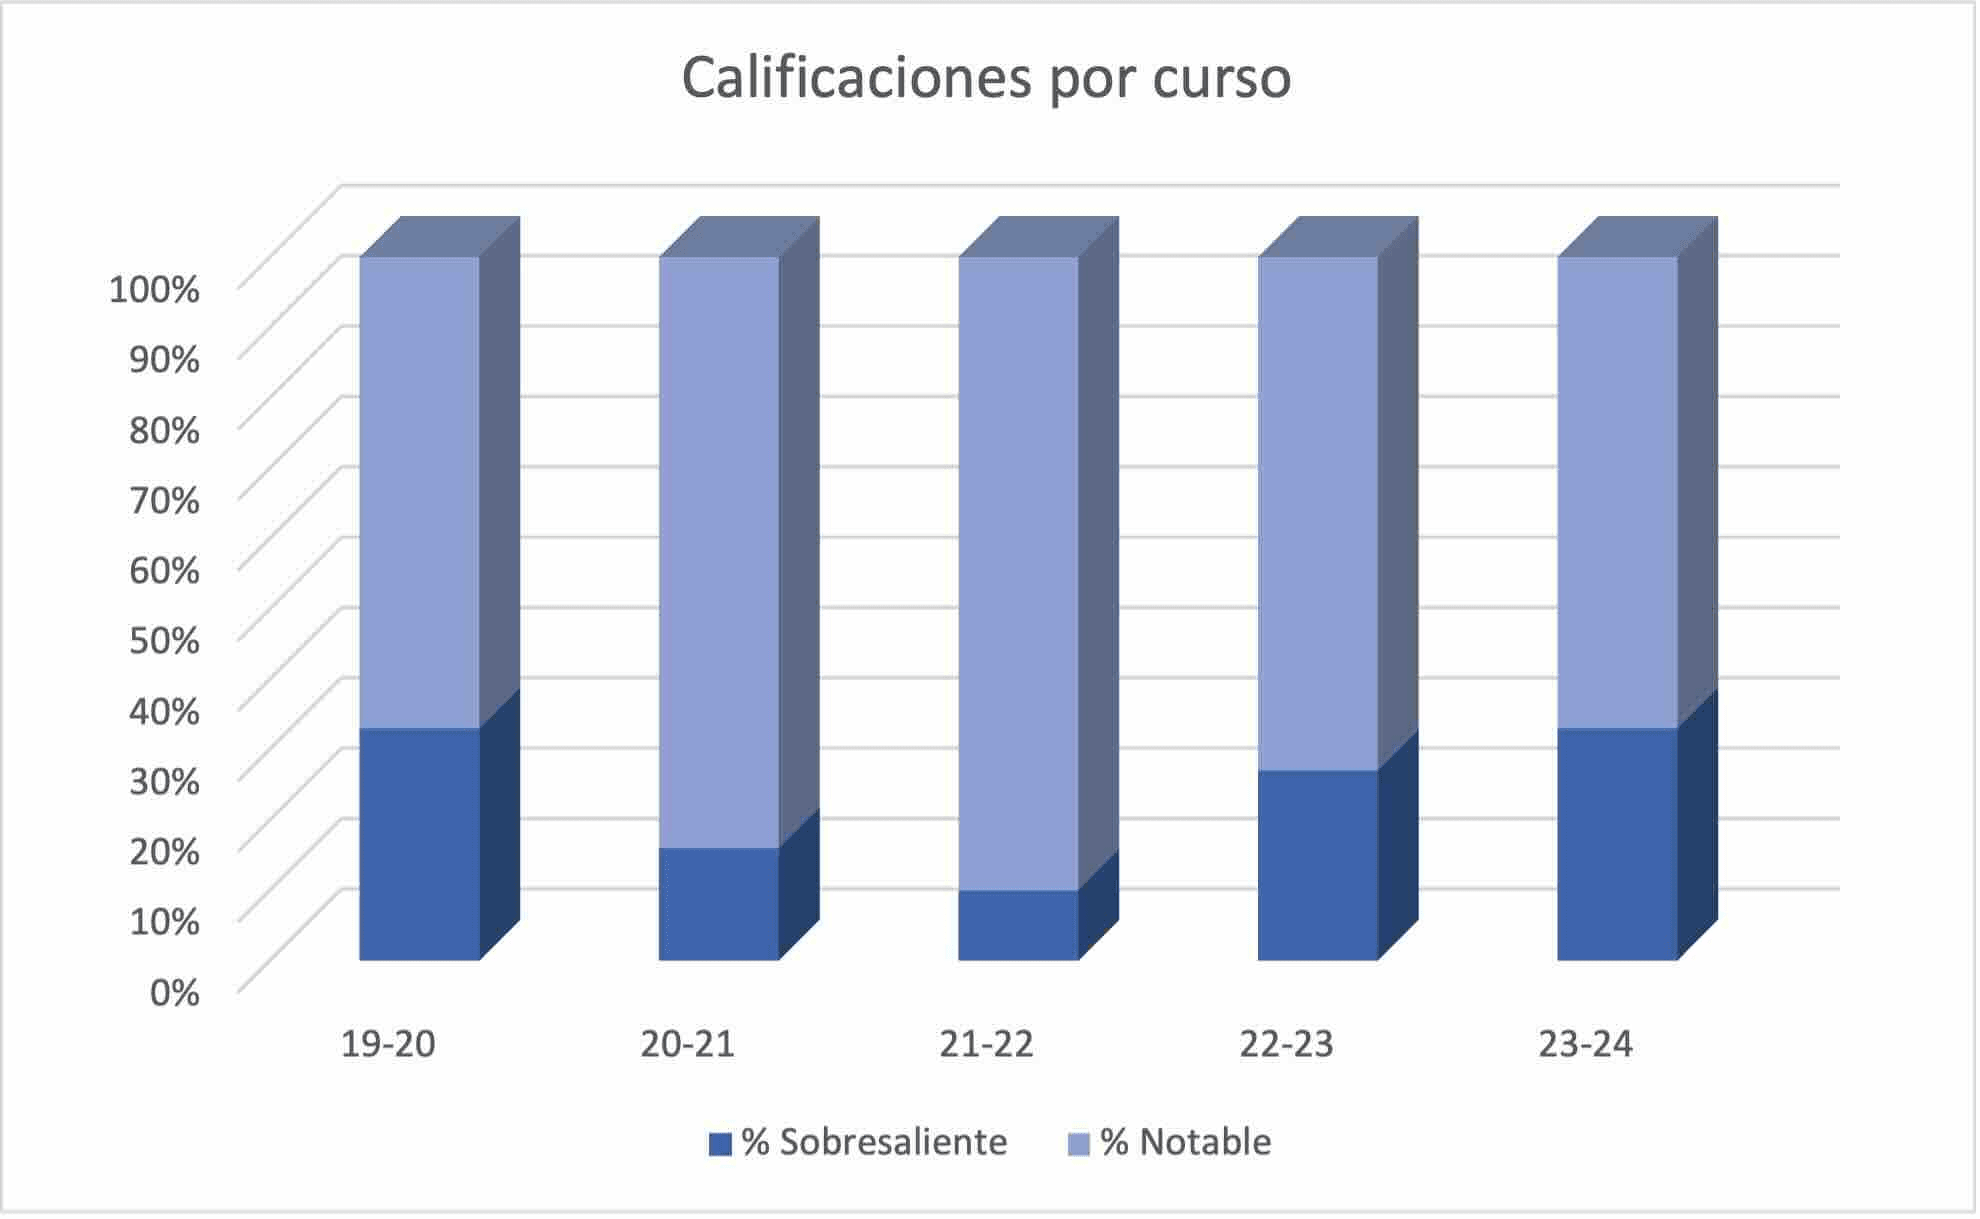
CALIFICACIONES POR CURSO
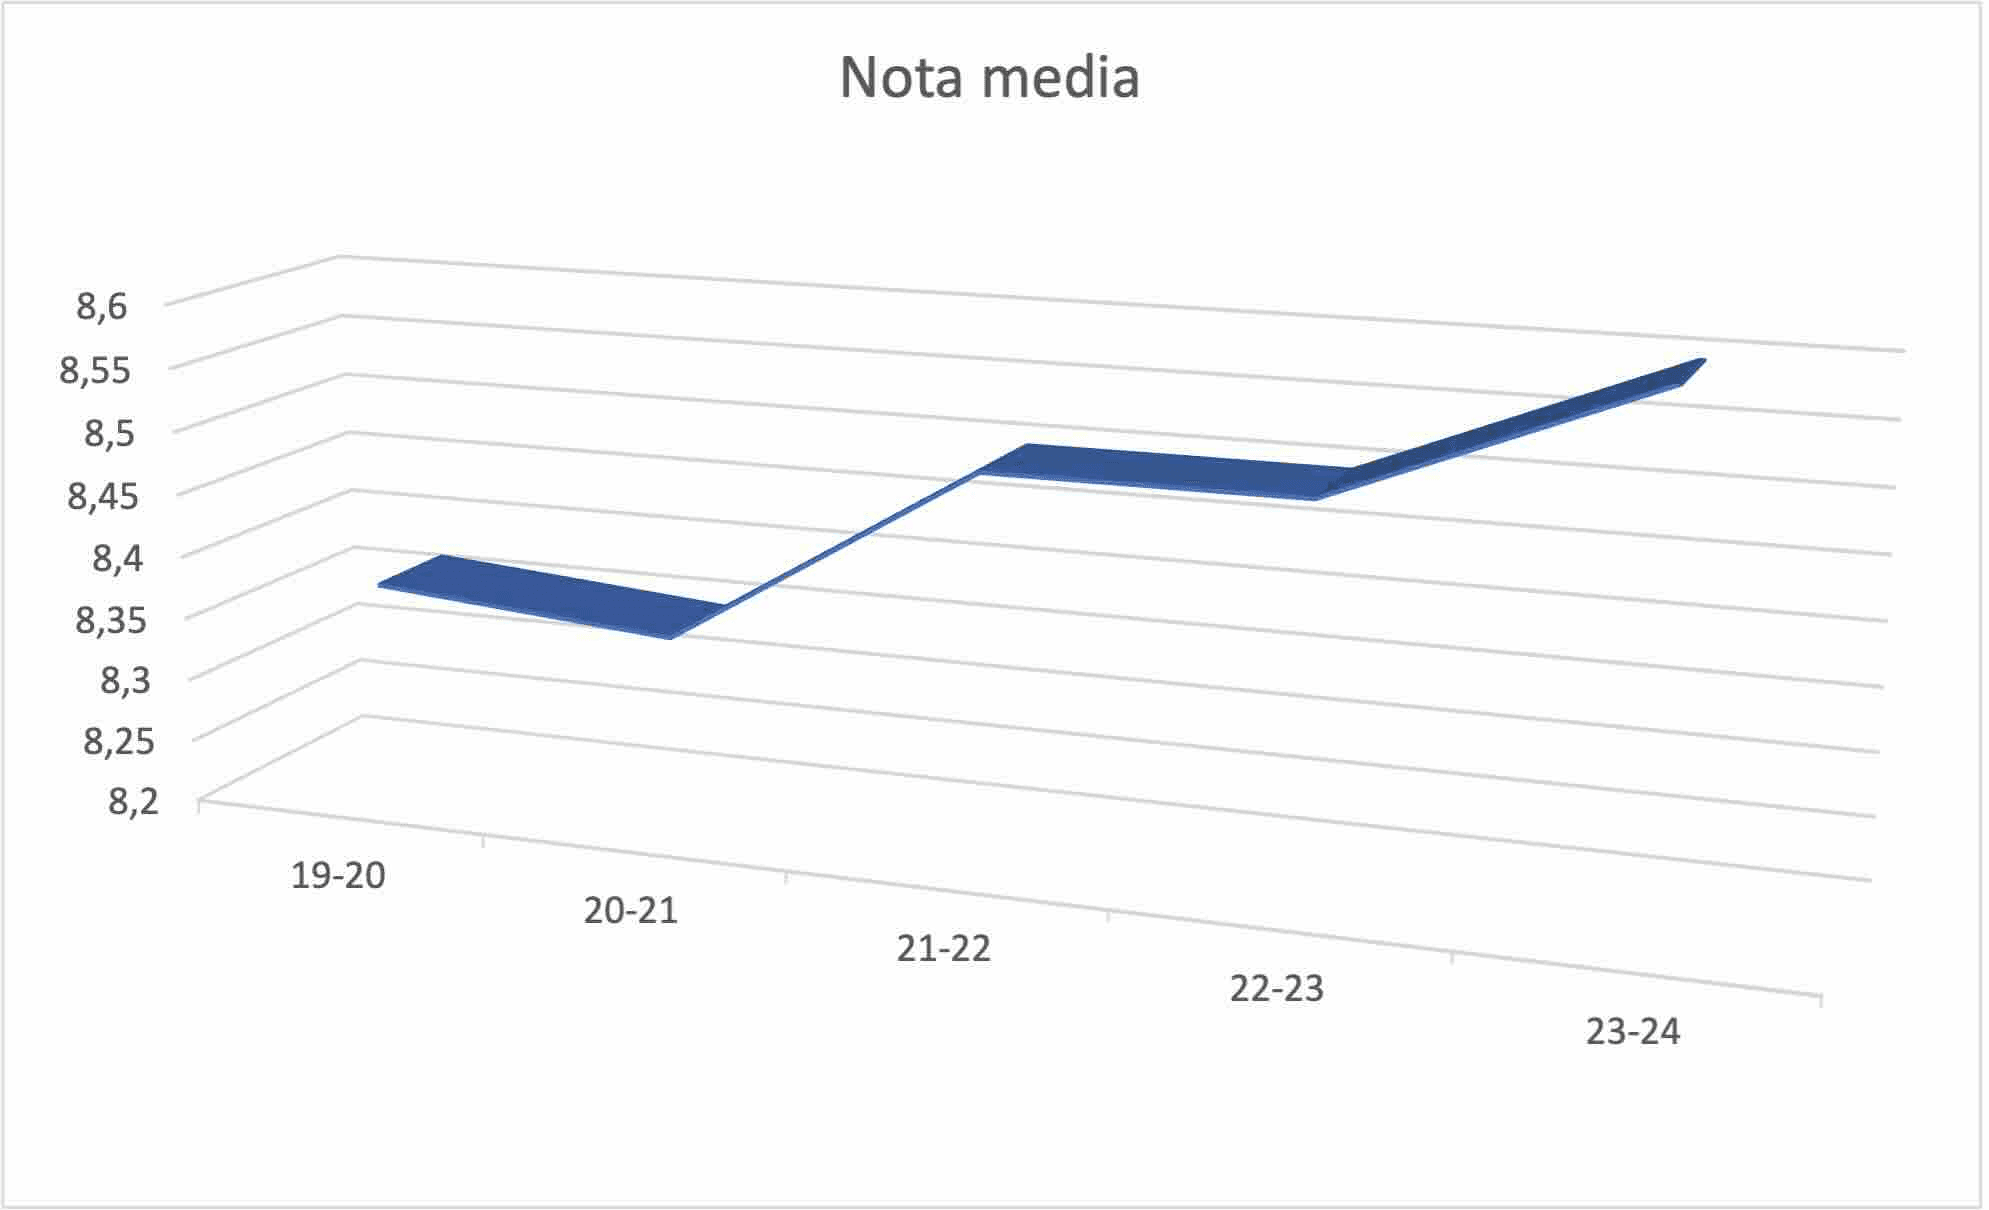
NOTA MEDIA
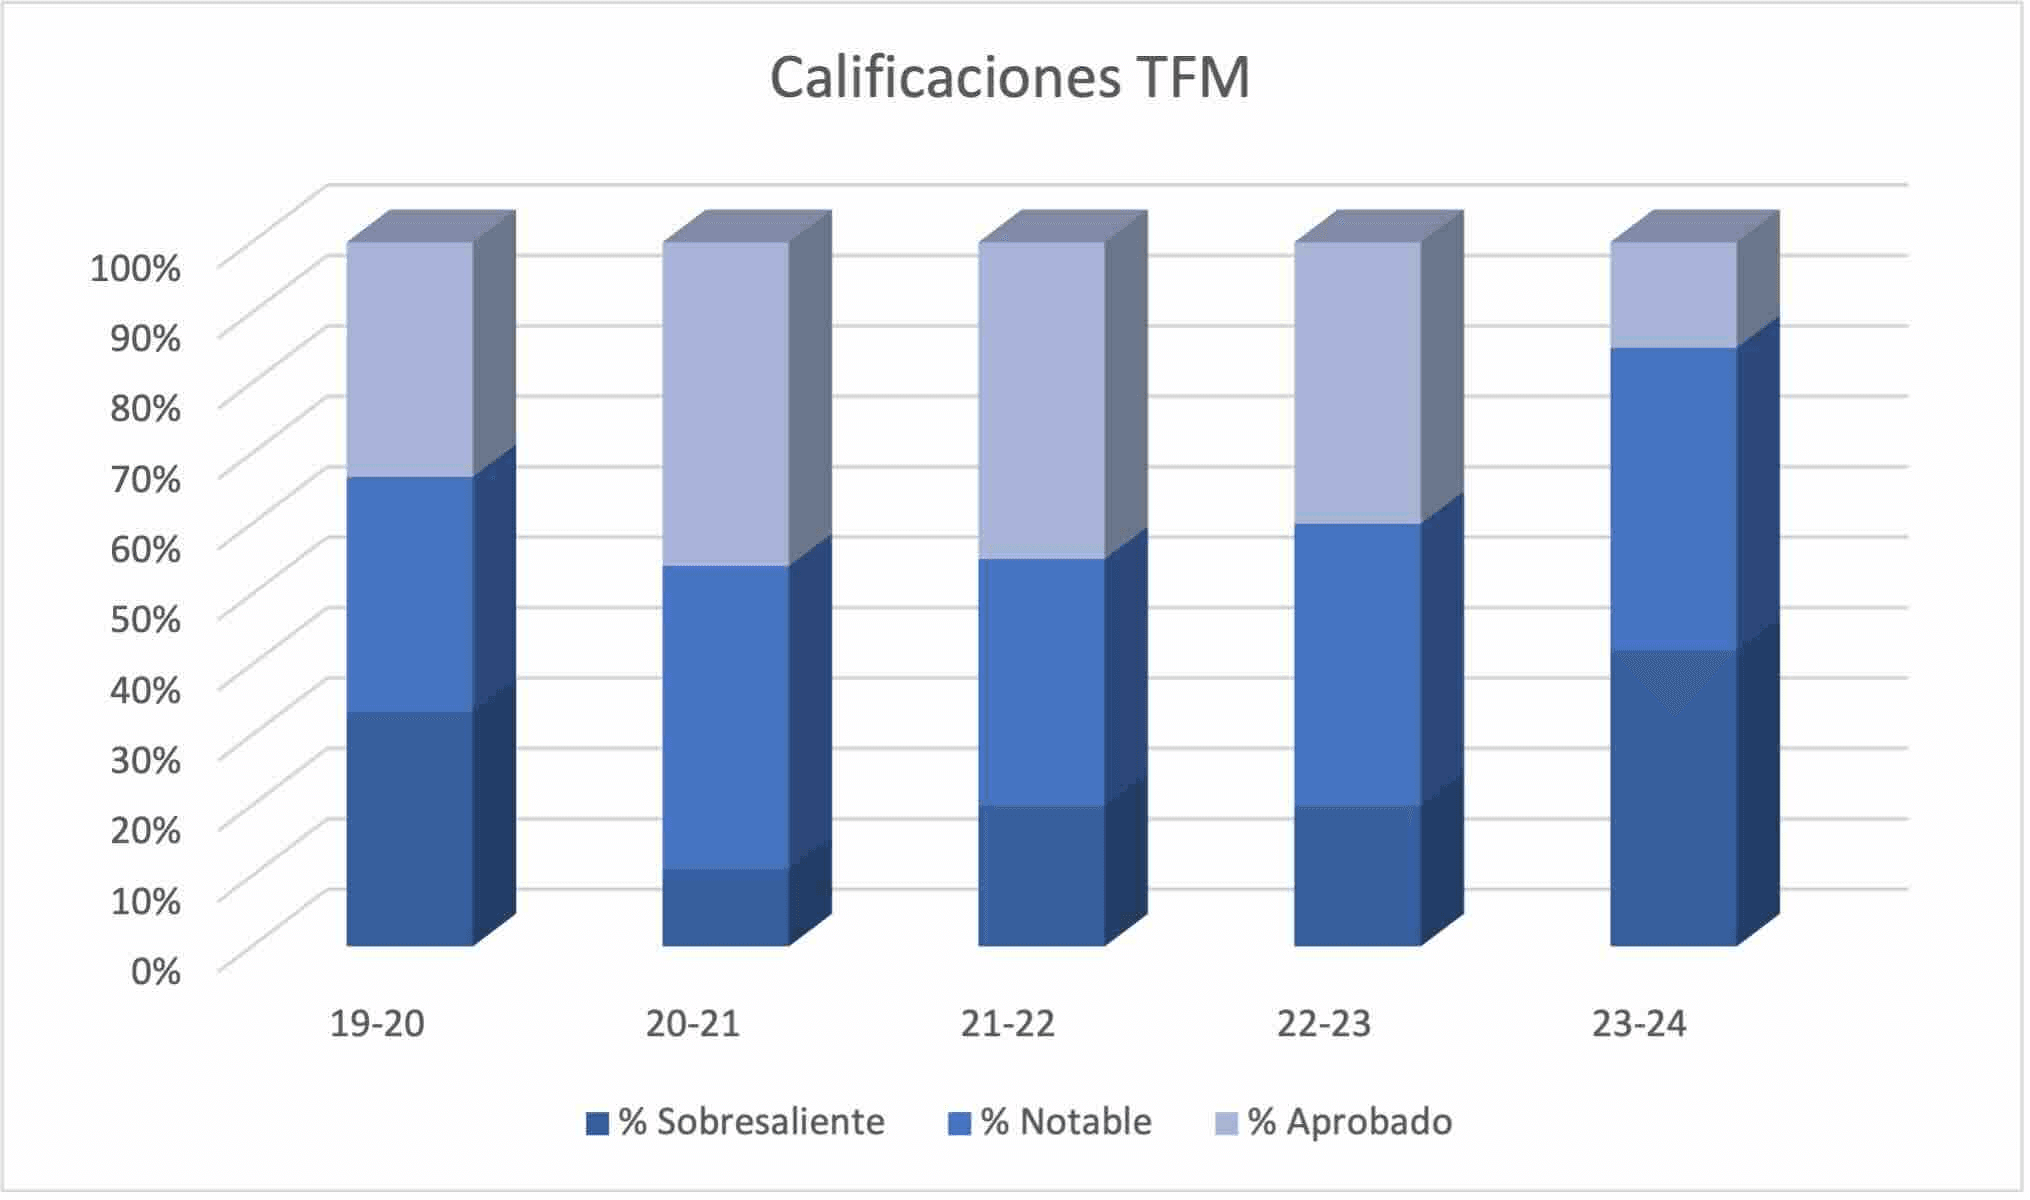
CALIFICACIONES TFM
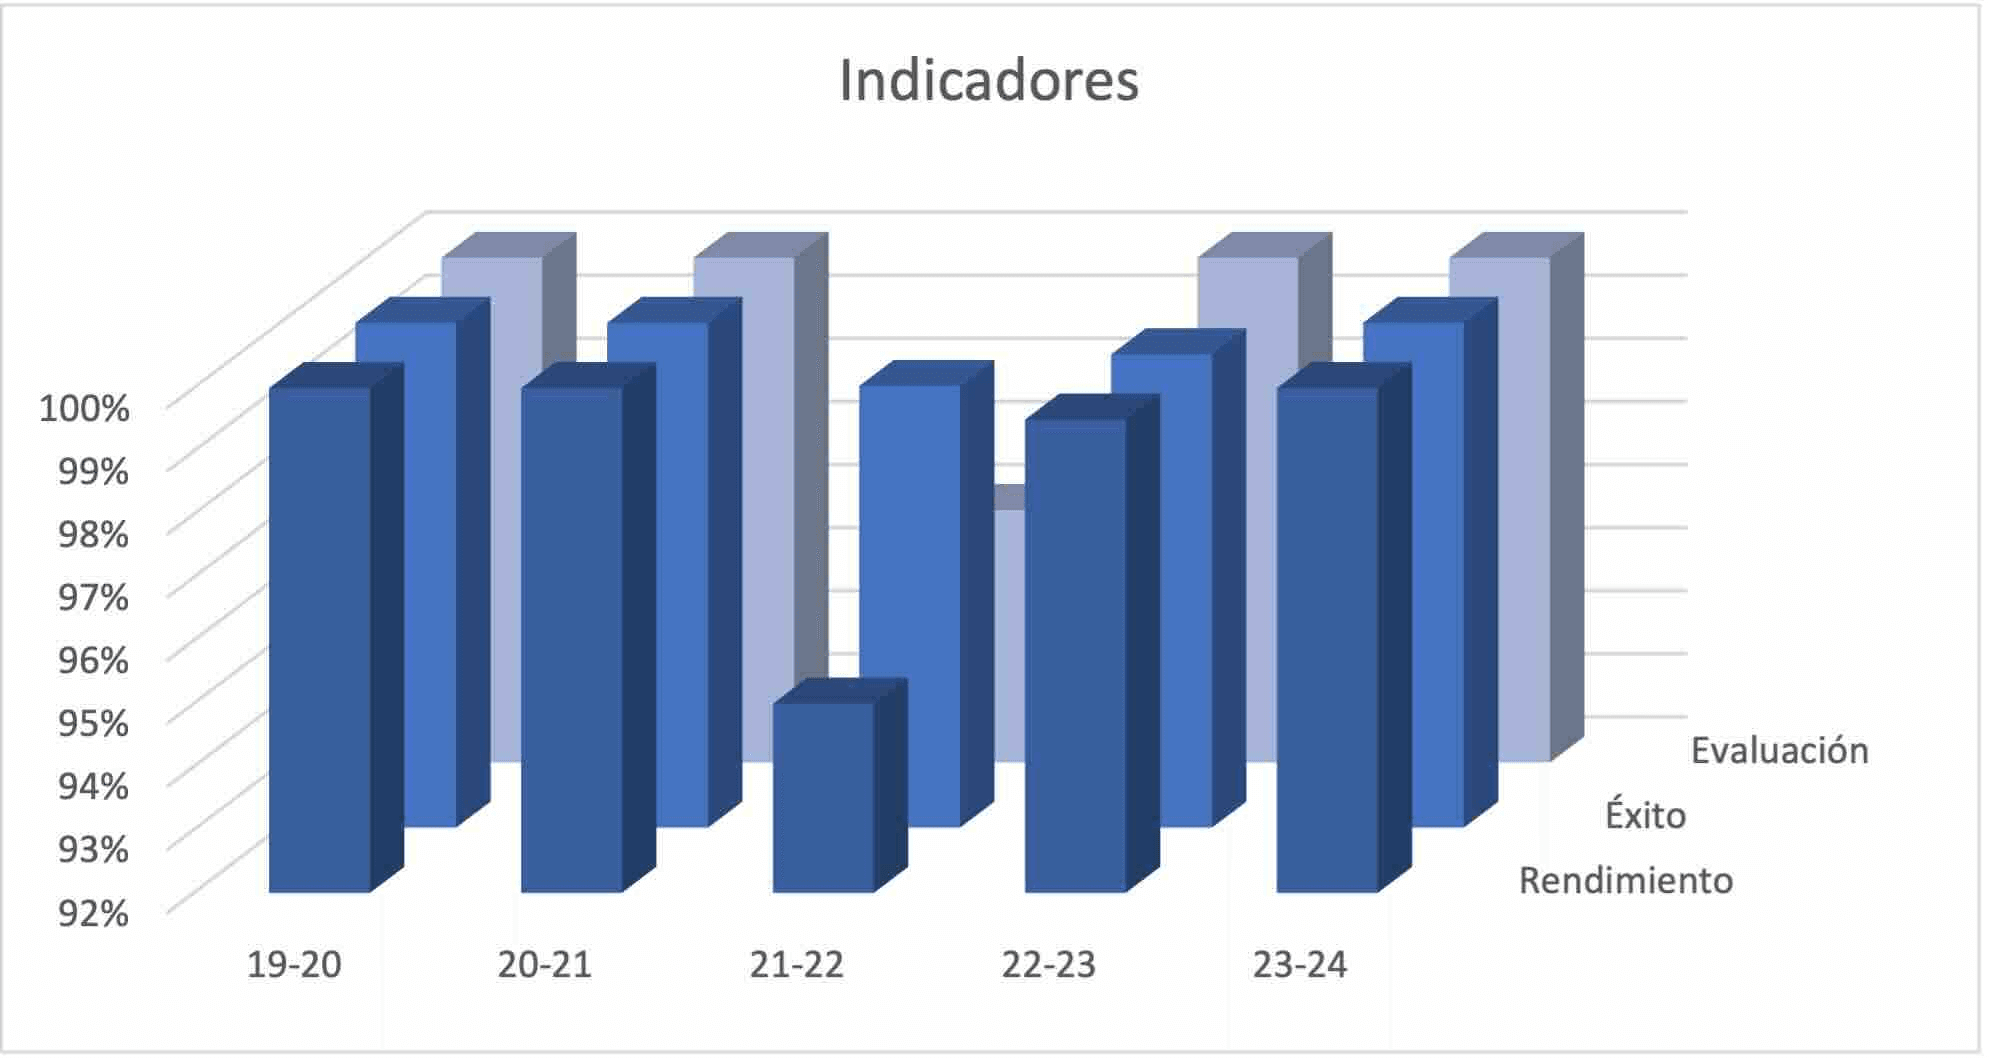
INDICADORES
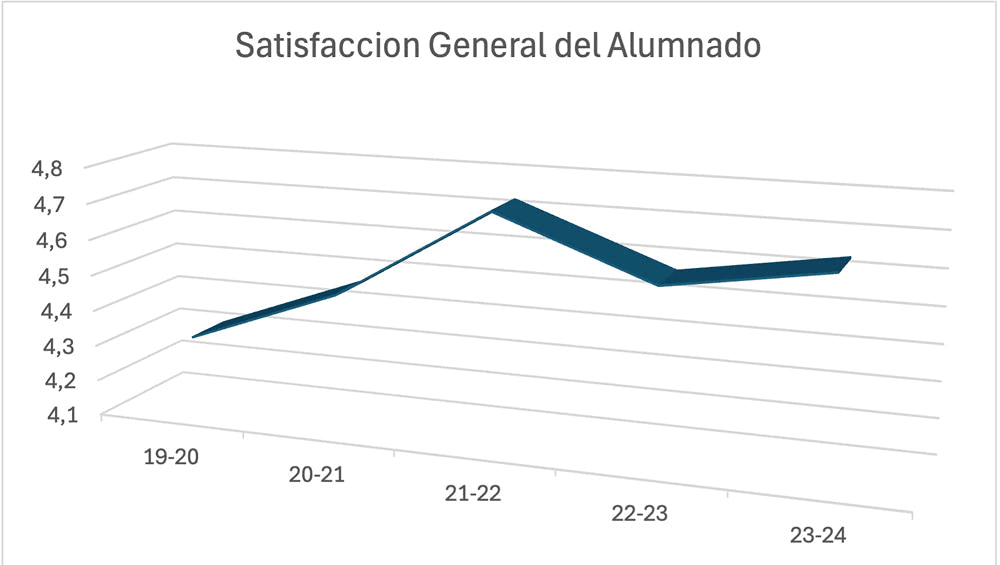
SATISFACCIÓN GENERAL DEL ALUMNADO
Máster en Relaciones Internacionales
EVOLUCIÓN DE LA MATRÍCULA
PERFIL DEL ESTUDIANTE DE NUEVO INGRESO
INSERCIÓN LABORAL
INDICADORES DE RENDIMIENTO


Annual Report
Annual Report
Memoria general IE University 2024-2025
Memoria general IE University 2023-2024
Memoria general IE University 2022-2023
Memoria general IE University 2021-2022
Memoria general IE University 2020-2021
Memoria general IE University 2019-2020
Memoria general IE University 2018-2019
Memoria general IE University 2017-2018
Memoria general IE University 2016-2017
Memoria general IE University 2015-2016
Memoria general IE University 2014-2015
Memoria general IE University 2013-2014