There’s likely one major shift that separates business models of the past from the present. That, of course, is the use of data for decision-making. Now, data science for business has become a priority for any company looking to compete in the global marketplace.
Are you looking to scale up your fledgling business? Want to hone your strategies? Let’s take a look at how data insights for business can get you the results you need.
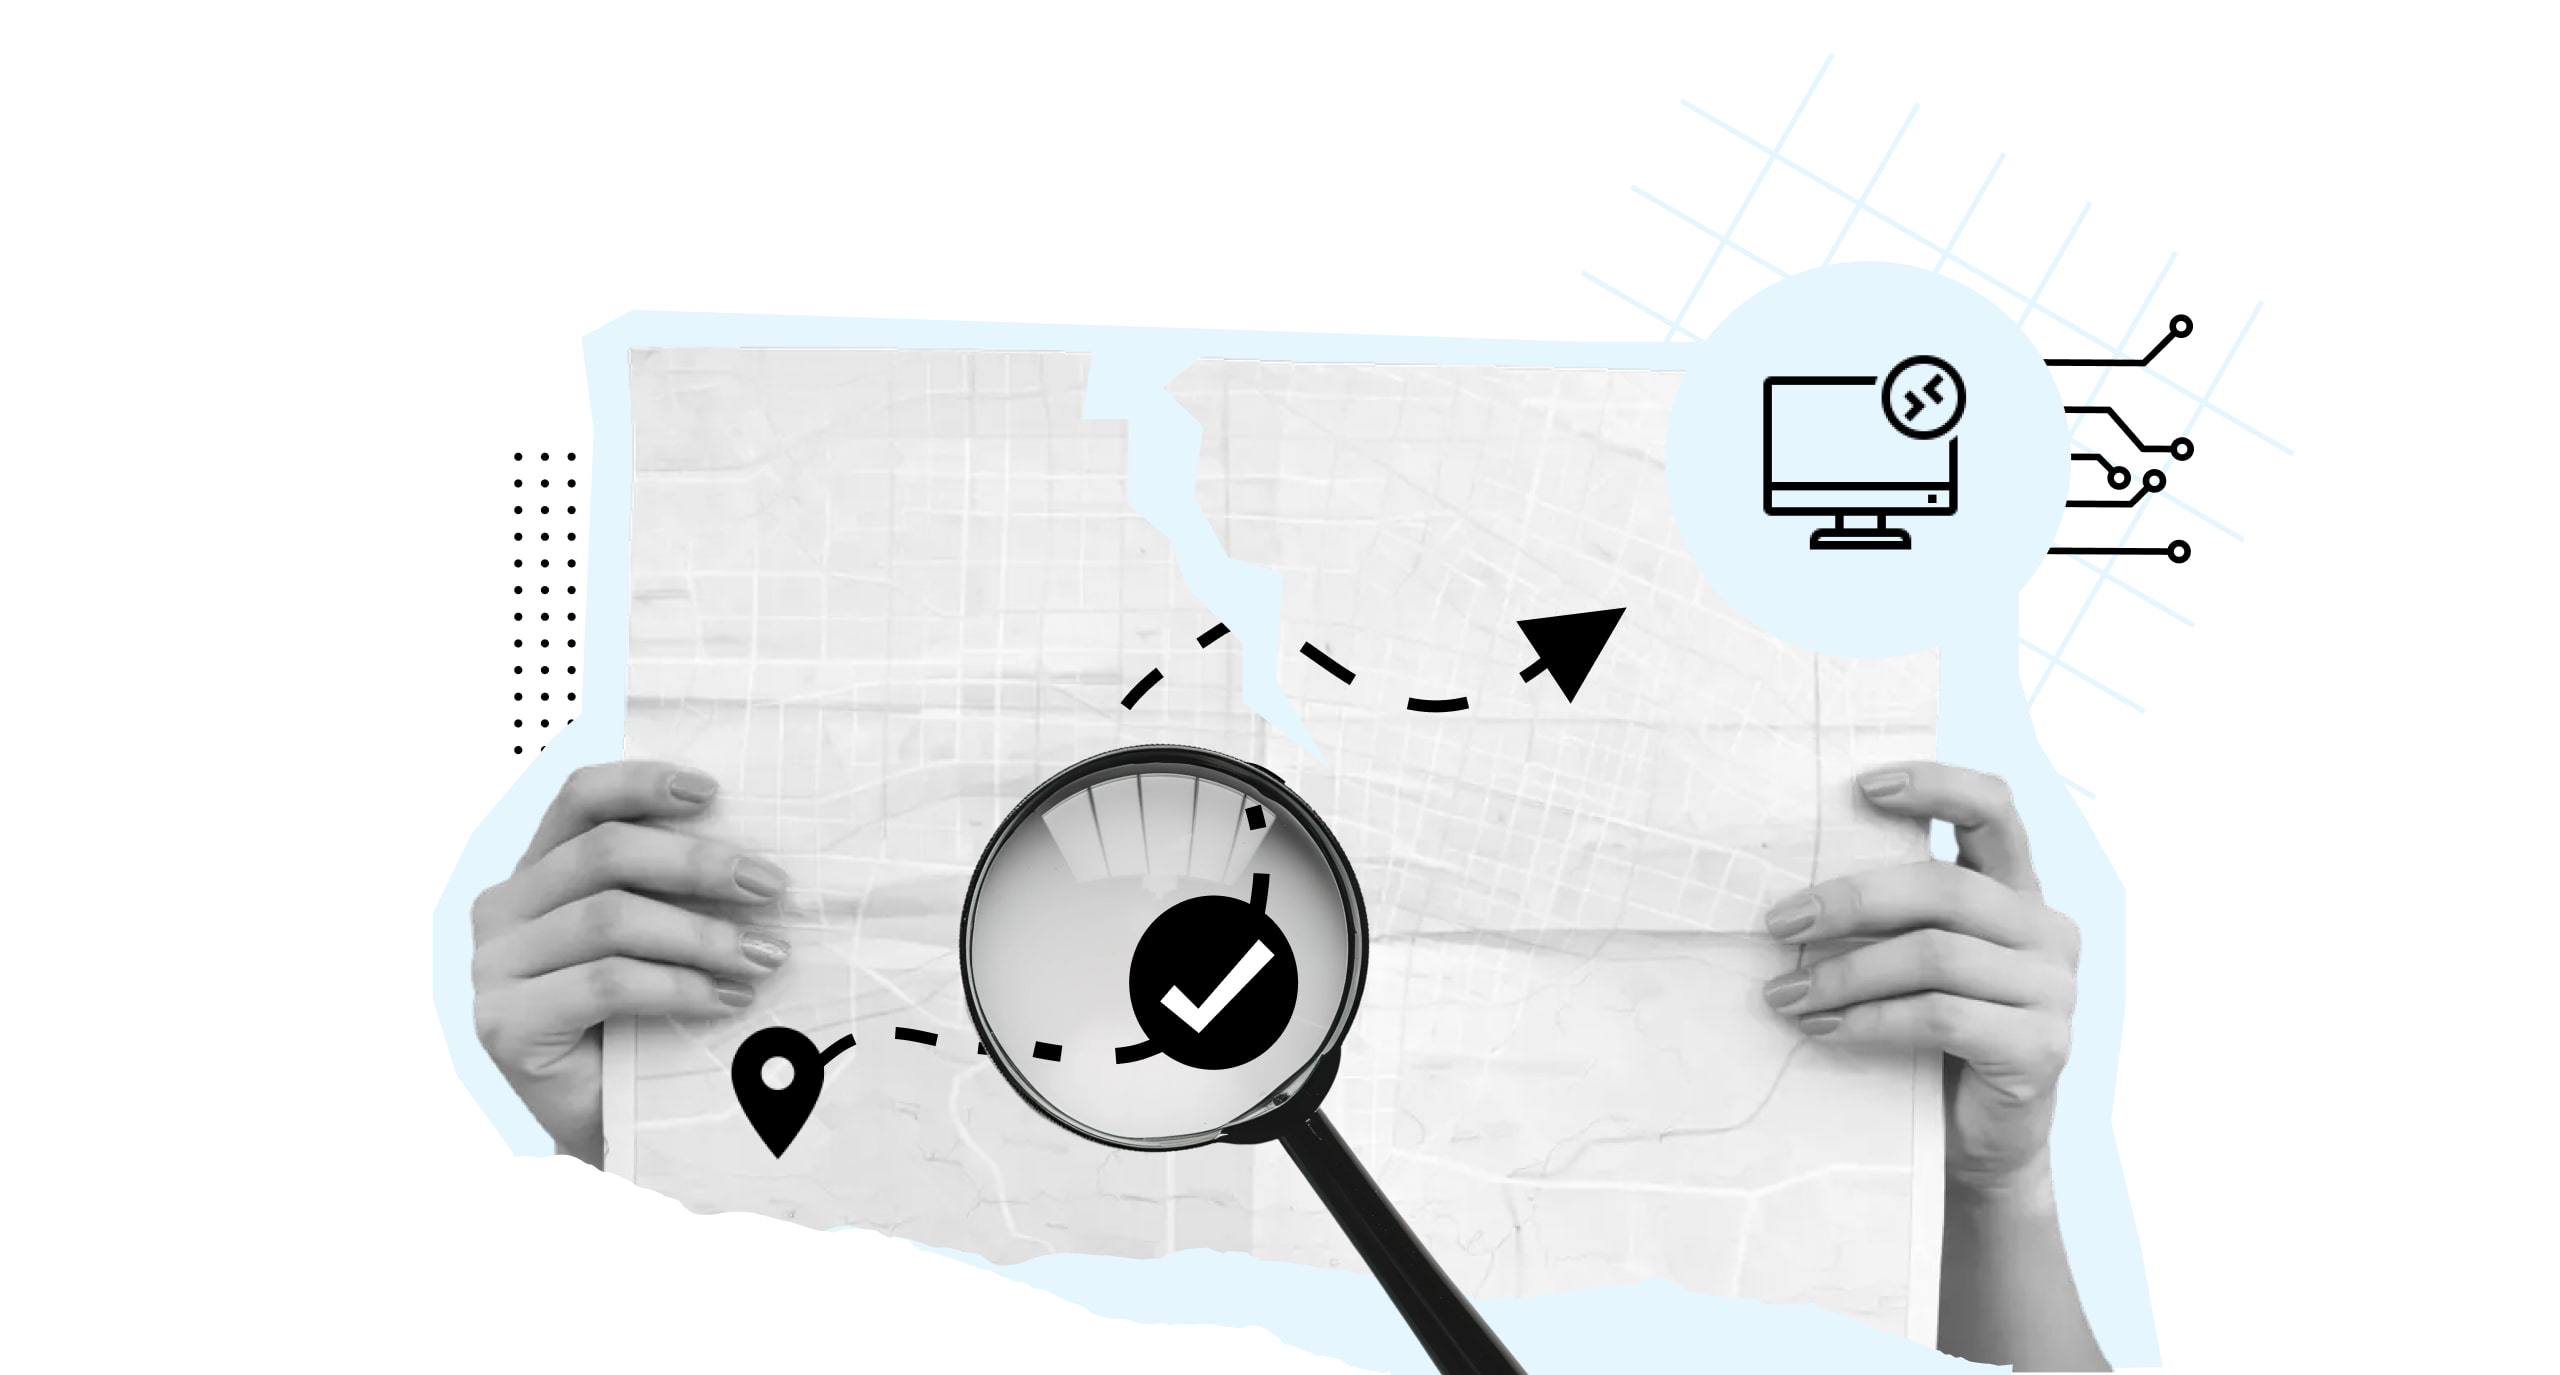
What is the role of data science in business growth?
Let’s go back to the emergence of this field. “Data science” was coined back in 2001, with initial widespread use in the finance industry. The money-men used data science to sift and analyze large amounts of data to reduce losses. Two decades on, it’s swept across all industries to help them better understand markets and their own operations.
It’s all about turning raw data into actionable intelligence. While collecting masses of data is essential, the value lies in how you analyze and apply this information. It’s a craft that combines techniques from mathematics, statistics and computer science to structure information into useful insights—which means swapping from intuition to evidence-based decisions. This, according to McKinsey, can improve operating margins by 60%.
Through analytics and predictive modeling, businesses can identify trends, detect patterns, and forecast future outcomes.

How does data science turn raw data into insights?
Raw data is messy. We collect it via spreadsheets, customer surveys, transaction logs or images. But to create data insights for business decisions, we need a structured approach to making sense of things.
Let’s break it down across seven steps.
1. Defining objectives
Before touching any data, you must be clear about what you’re trying to achieve. This will keep your analysis focused.
2. Collection
Relevant data sources will help you get the information you need quicker. You may choose sources like customer surveys, web analytics, financial reports or CRM logs.
3. Preparation
Raw data often contains duplicates, missing values and inconsistencies. At this stage, you want to clean up the formats and ensure all the data is error-free and readable. This is especially applicable if you’re pulling data from multiple sources.
4. Translation
Once clean, data must be processed using statistical tools or machine learning algorithms. Here, you’ll uncover patterns, correlations, or outliers. This is where numbers start telling a story—one about performance gaps, emerging trends, or customer behaviors.
5. Visualization
Using dashboards, graphs, or heat maps, turn your processed data into visuals that stakeholders can easily understand. The goal here is to make complex insights accessible and actionable.
6. Generation of insights
Not all findings are valuable. Actionable insights must be:
– Data-driven: Rooted in reliable, factual data
– Relevant: Addressing current, meaningful business challenges
– Specific: Focused enough to guide a concrete action
– Credible: Backed by trustworthy sources and sound analysis
7. Storing and security
Proper data governance is crucial. Store your data in compliance with privacy regulations and ensure it’s accessible for future analysis while staying secure.
How can businesses start using data science effectively?
The use of data science for business varies depending on the industry. For example, you have retailers analyzing customer behavior on e-commerce sites, which helps them refine UX or reduce cart abandonment. In the healthcare industry, hospitals have begun to use patient data to improve care. And logistics companies have benefited hugely from predictive analytics to anticipate delivery delays and facilitate global trade.
Further to this, manufacturers can predict failure of equipment to ensure its repaired in time. HR, on the other hand, are pairing AI with data to analyze applicants and flag potential employee turnover. And the long-term use of data in finance has evolved to detect fraudulent activity.
The most common cross-industry application of data is in helping us understand why humans do what they do.

Marketing teams are leveraging data for business by running A/B tests and customer segmentation models, which consequently makes their campaigns more precise. The same applies for retailers who need to adapt to seasonal demand shifts. Companies like Netflix are also using customer data to hone their subscription services by adapting content recommendation to user-specific insights.
What industries benefit most from data science?
The widespread adoption of data science for business is giving the global economy a major boost. Across industries, the global data science platform market is projected to grow to over $194 billion by the end of 2025. Deloitte estimates a growth to 76% in businesses investing in data capabilities.
Some industries are primed to get more out of data than others. But retail, healthcare and finance are the main players for the moment.
That said, even industries that weren’t historically data-heavy—like manufacturing or energy—are now dialed in.

Smart meters help utilities manage usage patterns and spot maintenance issues before they snowball. Governments are speeding up claims processing and catching fraud using data tools. And with the outsourcing world short on skilled talent, data science is helping firms automate back-office work and keep operations lean. Wherever you look, industries are leaning on data.
What tools are commonly used in data science for businesses?
1. Python
This beginner-friendly programming language is flexible and integrates easily with platforms like Excel and web frameworks. It’s a strong option for data analysis, automation and machine learning.
2. R
R is a statistical programming language for data analysis and visualization. Statisticians and researchers use it for complex analyses with a simple command-line interface.
3. SQL
Structured Query Language helps you clean and manipulate data directly inside databases. This makes it an essential for querying relational databases, along with easy integration with other tools.
4. Excel
This classic tool is still a powerful option for data organization, analysis and visualization. Data scientists can compile early-stage data exploration with its advanced formulas, pivot tables and VBA scripting.
5. Tableau
Tableau allows users to build interactive dashboards to visualize data and reports. You can integrate it with other tools and databases, which makes it useful for presenting insights to stakeholders in a clear, non-technical way.
6. Power BI
Microsoft’s business intelligence tool integrates with all Microsoft products and Azure, and is ideal for creating interactive visualizations and data models.
7. NumPy
Numerical Python provides efficient operations on large, multi-dimensional arrays. You can use it in data processing, mathematical modeling and performance optimization.
8. Pandas
Pandas is a Python library built on NumPy. Designed for data manipulation and analysis, it offers fast and flexible data wrangling by using labeled data structures. Data scientists use Pandas for reshaping datasets, especially for time series or tabular data.
9. Amazon Web Services (AWS)
AWS offers scalable cloud-based tools for storage, computing, and analytics. It supports data-intensive workflows with services like S3 for storage, EC2 for computing power, and SageMaker for machine learning. AWS allows data scientists to scale resources efficiently and manage large datasets without maintaining physical infrastructure.
10. Google Cloud Platform (GCP)
GCP is Google’s suite of cloud computing services, offering tools for data storage, machine learning, and scalable infrastructure. With services like BigQuery and Vertex AI, GCP enables data scientists to analyze massive datasets, train models, and deploy solutions with high efficiency and minimal setup.
Benjamin is the editor of Uncover IE. His writing is featured in the LAMDA Verse and Prose Anthology Vol. 19, The Primer and Moonflake Press. Benjamin provided translation for “FalseStuff: La Muerte de las Musas”, winner of Best Theatre Show at the Max Awards 2024.
Benjamin was shortlisted for the Bristol Old Vic Open Sessions 2016 and the Alpine Fellowship Writing Prize 2023.