
Does the idea of giving a presentation fill you with dread? You’re not alone. Glossophobia, the fear of public speaking, affects millions globally. Yet the secret isn’t eliminating fear—it’s mastering how you handle it. The antidote to fear is preparation combined with practice, and data storytelling provides a structured approach to crafting confident, persuasive, and impactful presentations. Master this method, put in the practice, and your nervousness will fade away.
What Is Data Storytelling and Why Is It Important?
Data storytelling is the bridge that connects us with the minds and hearts of others, enabling us to inspire action. It transforms raw data into relatable insights, making information easier to understand, remember, and act upon.
Its power is best explained through two recent business cases involving Google and Tesla that saw swings of billions of dollars in their respective values. In February 2023, Google presented its AI chatbot Bard to the world. However, during a demonstration Bard provided an incorrect answer regarding the James Webb Space Telescope that was quickly called out by scientists. This factual error led to a significant loss of investor confidence, resulting in Alphabet Inc.’s market value plummeting by over $100 billion in a matter of days. This case underscores how miscommunication or misinterpretation of data can have immediate and substantial financial repercussions.
In contrast, Tesla’s approach to data storytelling during the launch of its robotaxi service in June 2025 exemplifies effective storytelling. By initiating tests of its autonomous ride-hailing service in Austin, Texas, and sharing positive user experiences and performance data, Tesla successfully conveyed its technological advancements. This strategic narrative led to a surge in investor confidence, with Tesla’s stock rising over 9% and adding nearly $100 billion to its market capitalization.
While these examples from today’s tech giants show the strategic impact of data storytelling in the digital age, the roots of this discipline trace back to the 19th century—well before spreadsheets and dashboards.
Whilst working in the battlefield hospitals of the Crimean War (1853–1856), British nurse Florence Nightingale leveraged meticulous data collection and pioneering visualizations—specifically her iconic polar area diagrams (rose charts)—to demonstrate that most military deaths were due to preventable diseases, not battle injuries.
These charts leveraged the two critical factors in data storytelling; data maturity (collecting, managing, and leveraging data to drive informed decisions) and data literacy (understanding, analyzing, and communicating insights clearly). Indeed, Nightingale’s visual data storytelling effectively convinced British policymakers and Queen Victoria to implement sanitary reforms, dramatically reducing mortality rates in military hospitals.
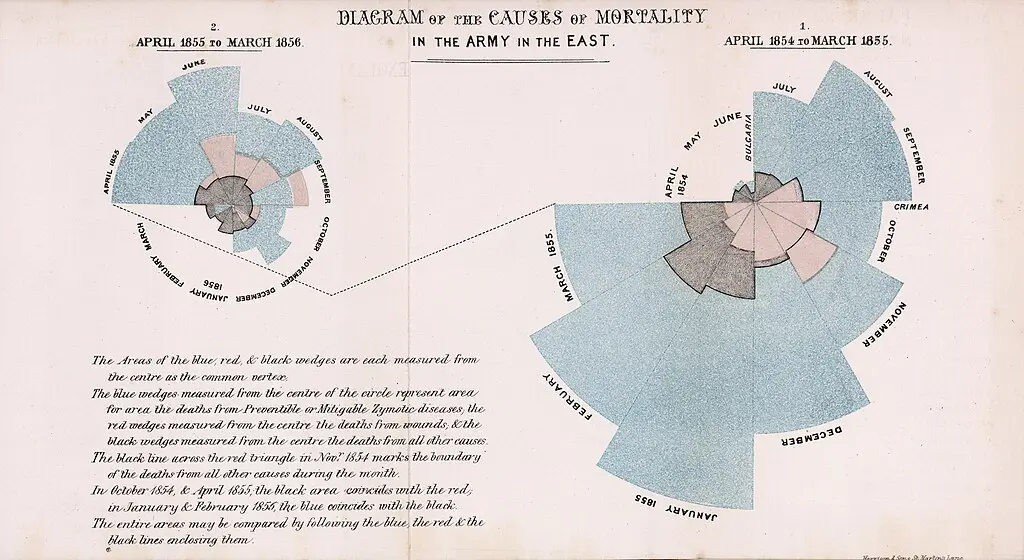
Diagram of the causes of mortality in the army in the East (1858) by Florence Nightingale
As Cat Wang and Paige Boklaschuk note, the Rose Diagram was more than science—it was a political tool. Through a compelling visualization of data, Nightingale overcame resistance to change and helped persuade the British government to reform sanitation in military hospitals, resulting in a drastic reduction in preventable deaths.
Why Data Storytelling Matters More Than Ever
From Florence Nightingale’s rose diagrams to Tesla’s investor presentations, the core principle remains the same: data alone doesn’t drive change—stories do. And in today’s hyper-distracted, data-saturated world, the need for effective data storytelling has never been greater for three reasons:
- We now live in the attention economy. The average human attention span has dropped from 12 seconds to just 8—and continues to shrink. Executives are overwhelmed by dashboards, spreadsheets, and endless performance metrics. In this noise, a clear and emotionally resonant story is what cuts through and gets remembered. The days of impressing stakeholders with volume are over; now, clarity is power.
- We are facing increasing decision paralysis. More data doesn’t automatically lead to better decisions—it often leads to hesitation or inaction. With more than 70 GB of information hitting us daily, people are mentally exhausted. Storytelling bridges this cognitive gap, distilling data into meaning and prompting action where charts alone fall short.
- AI-generated narratives falling flat. Storytelling is about human connection. While AI excels at the “what” and “how” of data – parsing massive datasets to find trends almost instantly, it struggles with empathy, nuance, and trust—qualities that are more critical than ever. In a time when institutional trust is at historic lows, human storytellers provide the emotional glue that can re-establish credibility by defining the “why” of data – infusing the numbers with meaning and emotion.
The Anatomy of Effective Data Storytelling in 7 Steps
So how do you tell a story with data that captures attention, builds trust, and drives action? Here’s a step-by-step breakdown.
1. Narrative Structure
Every compelling data story begins with a strong narrative seed—a short paragraph that captures your core message, sets up the challenge, and hints at the resolution. This forms the spine of your presentation and inspires a headline that resonates immediately. Think of Steve Jobs’ iconic motto for the launch of the iPhone in 2007: “Apple Reinvents the Phone.” The message was clear, bold, and future-focused—and it set the tone for everything that followed.
2. The Subplots Within the Main Plot
Once the main narrative is set, treat each slide or section as a mini-story. Give it a purpose, a headline, and a key takeaway. These subplots should ladder up to your main message while keeping your audience engaged.
3. Visual Intelligence
Good design is not decoration—it’s strategy. Use color, hierarchy, flow, and layout to emphasize insights and avoid visual noise. Ensure consistency with fonts, symbols, and layout elements to guide the viewer’s attention and reinforce your message.
4. Audience Empathy
Start where your audience is, not where you are. Grab attention with one of three powerful entry points:
- A bold statement: “I’ve been looking forward to today for two and a half years.”
- A surprising question or fact: “Did you know that people fear public speaking more than death?”
- A human story: “The idea of giving a commencement address left me with a win-win situation…”
5. Make it Human
Behind every data point is a human experience—reveal it. Data without empathy is easy to forget; data with a story is hard to ignore.
6. Actionable Insights
Close your story with clear, specific recommendations tied directly to business goals or strategic decisions. This is where data maturity and data literacy become critical.
- Data maturity – Without clean, reliable, and well-managed data, the insights presented could easily be ignored or mistrusted.
- Data literacy – By presenting insights clearly, the audience not only understands the information but knows how to act on it. It means knowing how to interpret trends, question assumptions, and translate numbers into narrative.
7. Call to Action
The previous steps allow you to deliver insights that are not just interesting but impactful. Use these insights to move people to act, to decide, to invest, or to change course.
By following these steps, you can steer clear of the most common pitfalls of data storytelling; overwhelming your audience with too much information, confusing them with cluttered visuals, or failing to connect insights to real-world actions.
Building Organizational Capability
Effective data storytelling is not a solo act—it must become part of your organization’s DNA. Here’s how:
• Develop a Visual Vocabulary: Equip teams with a shared understanding of visual best practices. A bar chart is never “just a chart”—it’s a language and an organization should set the best practices for this language.
• Practice Narrative Techniques: Storytelling is a muscle. Encourage teams to experiment with structure, tone, and voice.
• Invest in Technology and Training: Use AI and visualization tools to enhance storytelling—but never rely on them to replace human judgment, context, or creativity. Invest time and money in training.
• Create Feedback Loops: Establish a culture of review and refinement. Gather feedback, iterate, and continuously raise the bar.
Ultimately, the goal is to create an organization where everyone—from analysts to executives—can transform insight into influence.
The world is overflowing with data, but this unending well of information will go to waste without storytellers – those who understand the emotional and cognitive triggers that make information resonate. From the hand-drawn graphs of a 19th-century nurse to today’s AI-powered visualizations, the ability to tell a story that moves people remains the key to driving meaningful action.
© IE Insights.