It’s quite likely you’ve been asked to fill out a survey recently. Indeed, we are frequently inundated with such requests, whether they come from companies trying to gauge the market, managers hoping to understand employees, or politicians and focus groups looking to predict the outcome of a forthcoming election. And here’s the thing: surveys are often wrong! The usual response from the survey administrator to this common complaint is that mistakes should be expected to some extent because they are the result of statistical errors. But is this really true? Is it possible to tell whether the errors or mis-predictions of a survey are a result of a pure statistical error or, instead, some bias?
Let’s start at the beginning. The term statistical error simply refers to the fact that, when it comes to intangible human judgments and opinions, it is nearly impossible to make an exact prediction. Thus, the statistical error exists in the space between the predicted result and the truth. Since the truth is a rather slippery value, the best a survey can hope for is a very good approximation of the truth. For example, if a survey predicts that consumers are willing to pay 430 euros for full car insurance, the reality is that the survey predicts their willingness to pay around this price. If around is narrow, the approximation can be considered good enough. If around is wide, then the results are considered unreliable.
In addition to the expected (and relatively accepted as long as it is narrow) statistical error that comes with surveys, there are some other common sources of mis-prediction caused by bias in the survey process. Let’s examine three of them.
First, there is a lack of sample representativeness. To predict what a population will do, it is necessary to have a sample that is representative of that population. For example, if a given population (of geography or workforce or generation) is 60% female, then 60% of the survey respondents should be female. Although this sounds straightforward, in the age of big data and massive sampling, representativeness does not come bundled with sample size, although it is often assumed that it does – and this is a dangerous assumption. For example, surveys with tens, even hundreds of thousands of respondents grossly overestimated the uptake of first-dose COVID-19 vaccines, while a survey of just 1,000 people that followed suggested best practices was pretty accurate.
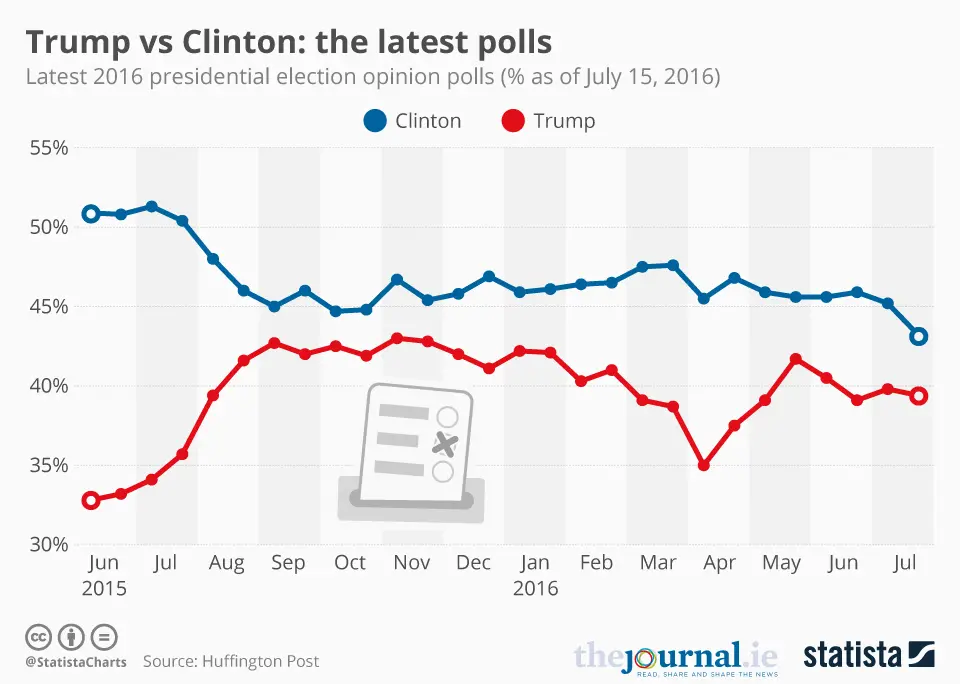
Second, respondents can often be reluctant to state their true opinion. This is most likely to happen when views on the topic are extremely polarized and it occurs these days with all kinds of issues ranging from politics to opinions regarding COVID-19, and, sadly, to wars. In such cases, many respondents may be reluctant to express their true opinion, even in anonymous polls, and this obviously skews the survey results. For example, leading up to the 2016 US presidential elections, the polls (almost) unanimously agreed that Clinton would win. They were wrong. A reason could be that one of the candidates (Trump) was highly controversial and widely criticized by popular media, and even by his own political party. This extreme criticism could have made Trump supporters refrain from stating their actual intentions in the polls.
Third, surveys are dry and, basically, unable to capture the richness of human behavior. Specifically, surveys are often excessively focused on the topic they are studying and thus fail to take into account the perspective of the respondent and how the surveyed topic is intertwined with numerous other decisions, opinions, and influences. For instance, a survey asks me how much I would pay for a mobile game. I kind of like the game, so I say $2. But later, when I enter the Google store, I see dozens of similar games that are available for free. So why would I pay $2? I don’t. I go against what I said in the survey and I choose the free option. In this case, the survey failed to capture what would influence me in the moment of making the game purchase. This is because there are different types of factors that may influence survey responses, perhaps heavily, (e.g. people may be influenced by hunger right before lunch or feel “splurgy” just before the summer holidays) that might not be present when it comes time to make the actual decisions (at the supermarket or on vacation.)
Similarly, when a survey asks, “How often do you plan to recycle?” people may genuinely reply that they plan to recycle every day. However, recycling entails giving up some amount of time, energy, and convenience, especially when done on a daily basis. So, when the time comes to make the tradeoff (get off the couch, sort the trash, and take it out to the recycling bin or… stay put and keep watching Netflix?), the easy choice might just be to not do the recycling that day. In this case, the survey question measured simple intent more than reality because it failed to capture the daily complications that might arise.
This inability of simple questions to account for the numerous influences that people face is perhaps the single most important reason behind the complaint about surveys that people say one thing and then do another. The way around this is to try to incorporate the setting of the behavior into the question. This is, of course, not easy. For instance, instead of flatly asking about willingness to pay for the mobile game, a survey can show the game of interest together with other similar games in the app store and then, in this more realistic context, ask the consumer about their willingness to pay. To predict recycling behaviors, a more balanced survey can ask respondents to think through what they are doing every day from 7 to 9 pm before asking them if they can squeeze 10 minutes out of that timeframe in order to recycle. The answers to these more detailed questions will likely be very different from those to the simple questions – and likely hit a little closer to the truth.
To get back to the initial question, how can we tell whether a mis-prediction of a survey is simply a statistical error or a result of some biased process? When we examine a single survey, the best tool to use is what is known in statistics as “confidence interval”. This is a range of values in which the “real” value of the population is expected to belong, with a certain probability. For instance, if the predicted willingness to pay for car insurance is $430, a confidence interval could say something like “the real willingness to pay lies between $410 and $450, with 99% probability.” So, first step, check confidence intervals to see if the discrepancy between survey results and reality is expected.
There is, however, a second step, which can be applied when many surveys are looked at together. It rests on the premise that statistical error is random – as in, sometimes it will overestimate and sometimes underestimate a value. So, if a series of surveys are performed and they, all together, either systematically underestimate or overestimate a value (as was the case with the 2016 US presidential election), then this is not random error (even if some discrepancies fall within the confidence interval) but bias and the survey methodology needs to be corrected.
As our world grows in complexity, it becomes increasingly difficult to collect good information and accurate data. Therefore, given this complexity, perhaps we shouldn’t complain about how surveys get it wrong, but instead try to understand their strengths and weaknesses in order to utilize them better. It’s certainly worth the effort because, when done well, surveys help us interpret the world around us and understand one other.
© IE Insights.