The last few years have seen great strides in analytics, data science, and big data. These once-alien concepts are now quite familiar. In the Harvard Business Review, Davenport and Patil called the data science profession “the sexiest job of the 21st century.” As early as 2012, James R. Evans called business analytics “the hottest thing going” and “the next frontier for decision sciences.” McKinsey predicted in 2011 that “by 2018, the United States alone could face a shortage of 140,000 to 190,000 people with deep analytical skills.”
What forces have driven these huge developments? Why are data science and analytics so in vogue today?
There are two fundamental factors that explain this shift. The first is the explosion of data that has occurred over the past few years. In 2012, according to IBM, 2.5 billion gigabytes of data were being generated worldwide each day. In 2020, according to Forbes, 1.7 megabytes of new data are generated per person every second.
The second factor behind this boom is technology: today’s computers are faster and have more storage capacity. This, together with the Internet of things, has resulted in a high level of computing power, as well as new and improved programming languages.
Data science promises to obtain more accurate answers through data analysis to change how decisions are made.
What is data science all about?
Data science lies at the crossroads of three disciplines: 1) computer science and information technology; 2) mathematics and statistics; and 3) the application of these two disciplines to a particular field.
This new branch of science promises to obtain more accurate answers through data analysis to change how decisions are made and detect new trends.
The applications of data science are highly varied. The first is informed, data-driven decision-making at all levels, from strategy to operations. The classic example of this is Google, which teaches all of its employees—regardless of category and rank—what to do with the data they obtain to ensure that they extract as much information as possible and make the best decisions.
Understanding consumer trends is another benefit of data science. For example, a meat-products company detected that its sales had not grown at the expected rate in the last two years. With the help of data science specialist Bernard Barr, the company set up a process to monitor the flow of people in its stores to help them understand the situation. They installed sensors in shop windows to find out how many people walked past the store, how many stopped to look at the ads posted in the windows, and how many went inside. The goal was to increase profits by taking advantage of peak foot-traffic hours outside the stores. The data collected showed that traffic was highest on the weekends, at a very specific time. The company therefore decided to adapt its product offering to better meet customers’ needs. After these changes were introduced, the percentage of the company’s income generated during the crucial weekend time slot rose to 50%.
In addition to the aforementioned applications, data monetization is a highly promising possibility for companies that currently use data as a product but do not perform any sort of analysis. A startup in the United Kingdom carried out an interesting study by placing microphones in streetlights and developing a very specific algorithm capable of isolating the sound of gunshots. The police can log on to the company’s website and obtain key information that can lead to a better understanding of crimes in a given neighborhood.
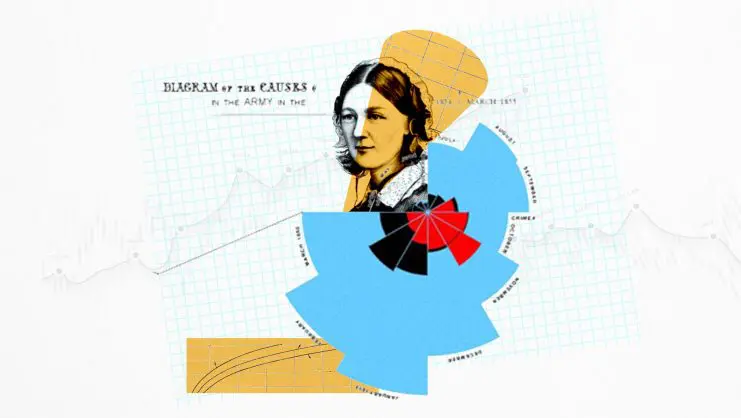
Visualization is a key step in any data science project, due to the large amount of information that can be extracted at a glance.
The power of visualization
Data are widely available and the ability to obtain accurate, relevant information is now beyond doubt. But how should information be presented to maximize the knowledge generated?
The first step in the data science process is to collect data from multiple sources. The next steps are to consolidate, clean, and transform the data, making them more understandable so that knowledge can be generated. This is where visualization comes into play, allowing information and patterns to be easily extracted. Visualization helps us really absorb the data and find good answers to the specific questions that lead to the next stage: modeling and simulation.
Visualization is therefore a key step in any data science project, due to the large amount of information that can be extracted at a glance. Whether through images, graphics, or video, knowledge emerges more immediately by means of useful, functional presentations. The areas in which data visualization can be applied range from business to social science and behavioral analysis.
In the world of data, visualization is a true untapped art with vast potential.
© IE Insights.