- Home
- News And Events
- What’s Going On
- Is The Stock Market Discounting A Cash-crunch?
Is the stock market discounting a cash-crunch?

The Ibex 35 has lost about 40 percent of its value over the last month. This time, though, banks and financial engineering are not the direct culprits of this mayhem. At least, not yet. Besides, many would agree that, with the exception of the oil and gas firms directly affected by the recent “oil price war” between Russia and Saudi Arabia, the business fundamentals have not changed substantially in such a short period to justify this reaction.
Antonio De Vito, professor of Accounting & Management Control at IE Business School - IE University.
Juan-Pedro Gómez, professor of Finance at IE Business School - IE University.
This begs the question: what is the market discounting so dramatically? One could argue that, with the whole country locked-down, demand will plummet. Disruptions in the supply of intermediate and final goods will also have an impact. However, are the markets really so shortsighted? While the economic risks of pandemics are not trivial (IMF 2018), the decline in global economic activity is usually temporary (IMF 2006), such that we could already reasonably foresee the demand to rebound once the uncertainty is resolved.
A more plausible explanation for the observed market reaction is that a prolonged depression of market demand would likely make profitable, yet cash-constrained firms go bankrupt. Indeed, although banks should theoretically be willing to lend to profitable firms, the experience from the 2008 financial crisis has taught us that many firms (and investors) are right to feel, at best, skeptical about this assumption.
If policymakers do not intervene swiftly, even temporary shocks could lead to a liquidity crisis with long lasting damage that the market rightly discounts.
The short-term liquidity risk
In this note, we test this conjecture by performing several stress tests on the short-term solvency of 129 Spanish listed firms. To assess the short-term liquidity risk, we first compute two financial ratios for each firm using the 2018 financial statement as our base case scenario, which is also the last reporting period currently available.
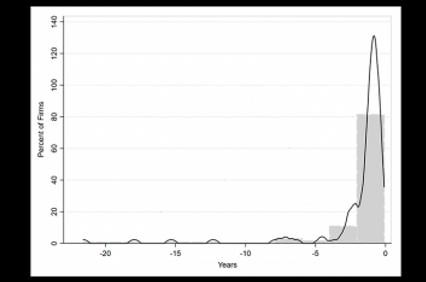
The first ratio is the “Cash Burn Rate”, whereas the second ratio is the “Cash flow from operations to short-term debt” (definitions are shown below). The cash burn rate measures how long a firm is able to finance its operating costs without any further cash contribution from creditors or shareholders. In our context, this ratio indicates how many years it would take for the firm’s current cash flow from operations to build up (if positive) or burn (if negative) its cash holdings.
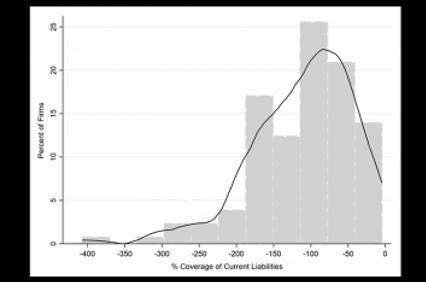
On the contrary, the cash flow to debt ratio estimates the percentage of current liabilities (including short-term debt) covered by the annual cash flows from operations if these are positive, or the expected growth in short-term liabilities if the cash flows are negative. Second, we “stress-test” both ratios by simulating three alternative outcomes, which correspond to a drop in sales of 10, 25, and 50 percentage points. We label the three distress scenarios as low, moderate, and high-risk, respectively.
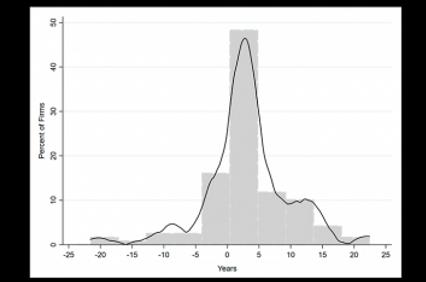
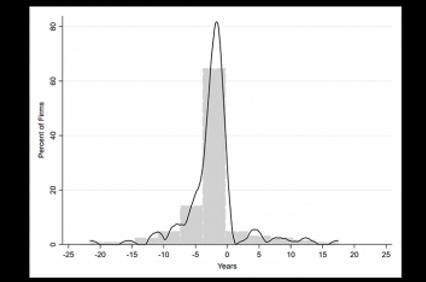
We plot the distribution of ratios across all firms in our sample and compare the base case scenario to the three possible outcomes. In the base case scenario, for the median firm, cash holdings account for about 3 years of annual operating cash flow. However, if the sales were to drop by 10 percentage points, the median firm would start burning its cash holdings and would exhaust it in slightly more than 2 years. This burnout period would shrink as demand contracts, and it would last just one year in the high-risk scenario.
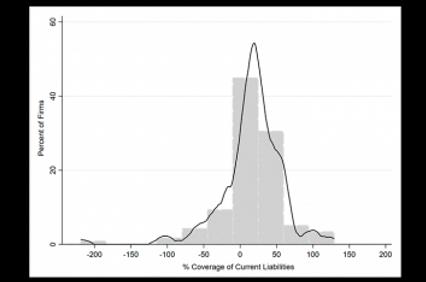
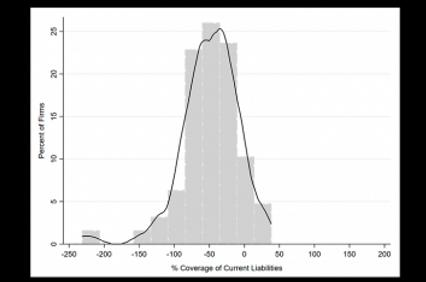
What are the implications for the financing of short-term liabilities? In the base case scenario, the median firm is able to cover about 15 percent of its current liabilities using the cash flows from operations. However, the short-term liabilities of the median firm would increase by about 8, 47, and 97 percentage points if the sales were to drop by 10, 25, and 50 percentage points, respectively. Thus, the current liabilities could almost double for the median firm in the high-risk scenario. This implies a potential spillover effect that would magnify the impact of a sales drop on the cash burn rate of suppliers.
Most at risk firms: burning all the cash holdings?
Next, we focus on the most at risk firms and estimate how many would burn all their cash holdings in just half a year for each of the three possible distress scenarios. We find that 3, 7, and 19 firms would deplete their cash reserves in half a year in the low, moderate, and high-risk scenario, respectively. The 19 firms ending up with empty pockets in the high-risk scenario are mostly in the manufacturing sector. On average, these firms are half the size of the average firm in the sample and they have a leverage ratio which is, on average, one-third larger than that of the sample mean.
The 19 firms ending up with empty pockets in the high-risk scenario are mostly in the manufacturing sector. They are relatively small firms, highly leveraged and with low return on assets.
Further, these firms have an average return on assets of about −3.2 percentage points, which starkly contrasts with that of the average firm in the sample (i.e. about +3.8 percentage points). In sum, these are relatively small, unprofitable and leveraged firms, which are more likely to run out of cash if things turn ugly. They are also more likely to be out of the debt market in the event of severe distress.
Fiscal measures
Finally, we evaluate what fiscal measures could be more effective if the policymaker decided to intervene. For example, some European governments, such as Italy or Sweden, have already granted tax deferrals, while others are still considering doing so.
Our analyses suggest that a three months tax deferral would not be of much value for Spanish listed firms, as the number of firms running out of cash in the next six months would not change and it would still amount to 19 in the most adverse scenario. This number would only decrease by only two firms if the tax deferral were to last up to six months. However, this marginal change in the number of potential cash-constrained firms is not entirely surprising, because these firms are, on average, unprofitable and do not pay much tax in the first place. For these firms, a German-style “bazooka” of loans would probably be more effective at mitigating the liquidity risk.
Even a six months tax deferral would not be of much value for the most vulnerable Spanish listed firms. Loans and/or guarantees would be more effective to prevent a cash-crunch.
A healthy cash-cushion
To conclude, our findings suggest that Spanish listed firms, on average, have a healthy cash-cushion, which appears to be robust to several distress scenarios. It is therefore difficult to justify the heavy drop in the market value of these firms based on a cash crunch hypothesis, since less than 15 percent of our sample firms are likely to be liquidity-constrained in the short-run in the most severe scenario.
For these firms, tax deferrals would be only marginally effective, while loans and loan-guarantees could be a more advisable approach. Finally, we believe that the impact on private firms could even be larger, since these firms, like the most vulnerable ones in our sample, are smaller, probably more leveraged, and with limited access to alternative financing sources outside the banking system.
Variables definitions:
Cash Burn ratio = (Cash and Cash Equivalents + Short-term Investments + Accounts Receivable) / Net Cash Flow;
Net Cash Flow = Cash flow from Operations − Current Taxes – Interests;
Cash flow from Operations = Sales − Operating Costs;
Cash flow from Operations to Short-term Debt = Net Cash Flow / Current Liabilities;
Return on Assets (ROA) = Earnings before Interests and Taxes / Total Assets;
Leverage Ratio = Total Debt / Total Assets
FIGURE 1. CASH BURN RATE AND CASH FLOW FROM OPERATIONS TO SHORT-TERM DEBT RATIO
FIGURE 1. CASH BURN RATE AND CASH FLOW FROM OPERATIONS TO SHORT-TERM DEBT RATIO
Base Case Scenario – No Sales Drop
Panel A: Cash Burn Rate No Drop in Sales
Panel B: CFO to Short-term Debt Ratio
Moderate Risk Scenario – 25% Sales Drop
Panel A: Cash Burn Rate No Drop in Sales
Panel B: CFO to Short-term Debt Ratio
High Risk Scenario – 50% Sales Drop
Panel A: Cash Burn Rate No Drop in Sales
Panel B: CFO to Short-term Debt Ratio
Data source: Compustat Global for the 2018 fiscal year. We start by downloading all available firms listed in Spain (184). We exclude financial institutions (54) and firms with missing data for our variables of interest (1). Our final sample corresponds to 129 Spanish listed firms across all industries.Detail
